We are excited to announce the 25R3.0 release. The new capabilities delivered include:
Compass Patient, Pathway, & Data Connector
Compass Patient & Compass Pathway Data Quality Improvements
We are enhancing a number of attributes for quality and fill rates.
- Improved provider quality on 114 million medical claims, through converting single provider HCOs to the rendering provider’s NPI, increasing the visibility of 49 thousand HCPs
- Improved provider quality on 3.3 million records that now reflect a provider NPI instead of the HCO’s tax id number
- Improved diagnosis code quality on 13 million records, through expanded formatting requirements
- Improved product quality on 1.5 million records that now have a valid Product ID or Original Product ID due to mapping 10-digit NDCs to their 11-digit NDC counterparts
- 5% improvement on Ethnicity fill rate, providing more insight into patient demographics
- Improved visibility to Procedure Code Modifiers on 18 million records through expanded Procedure Code Modifier 2 to now displaying multiple modifier 2’s per claim
- Improved Quantity Dispensed accuracy through adding decimals to relevant prescription claim values
Compass Patient Disease Area Search
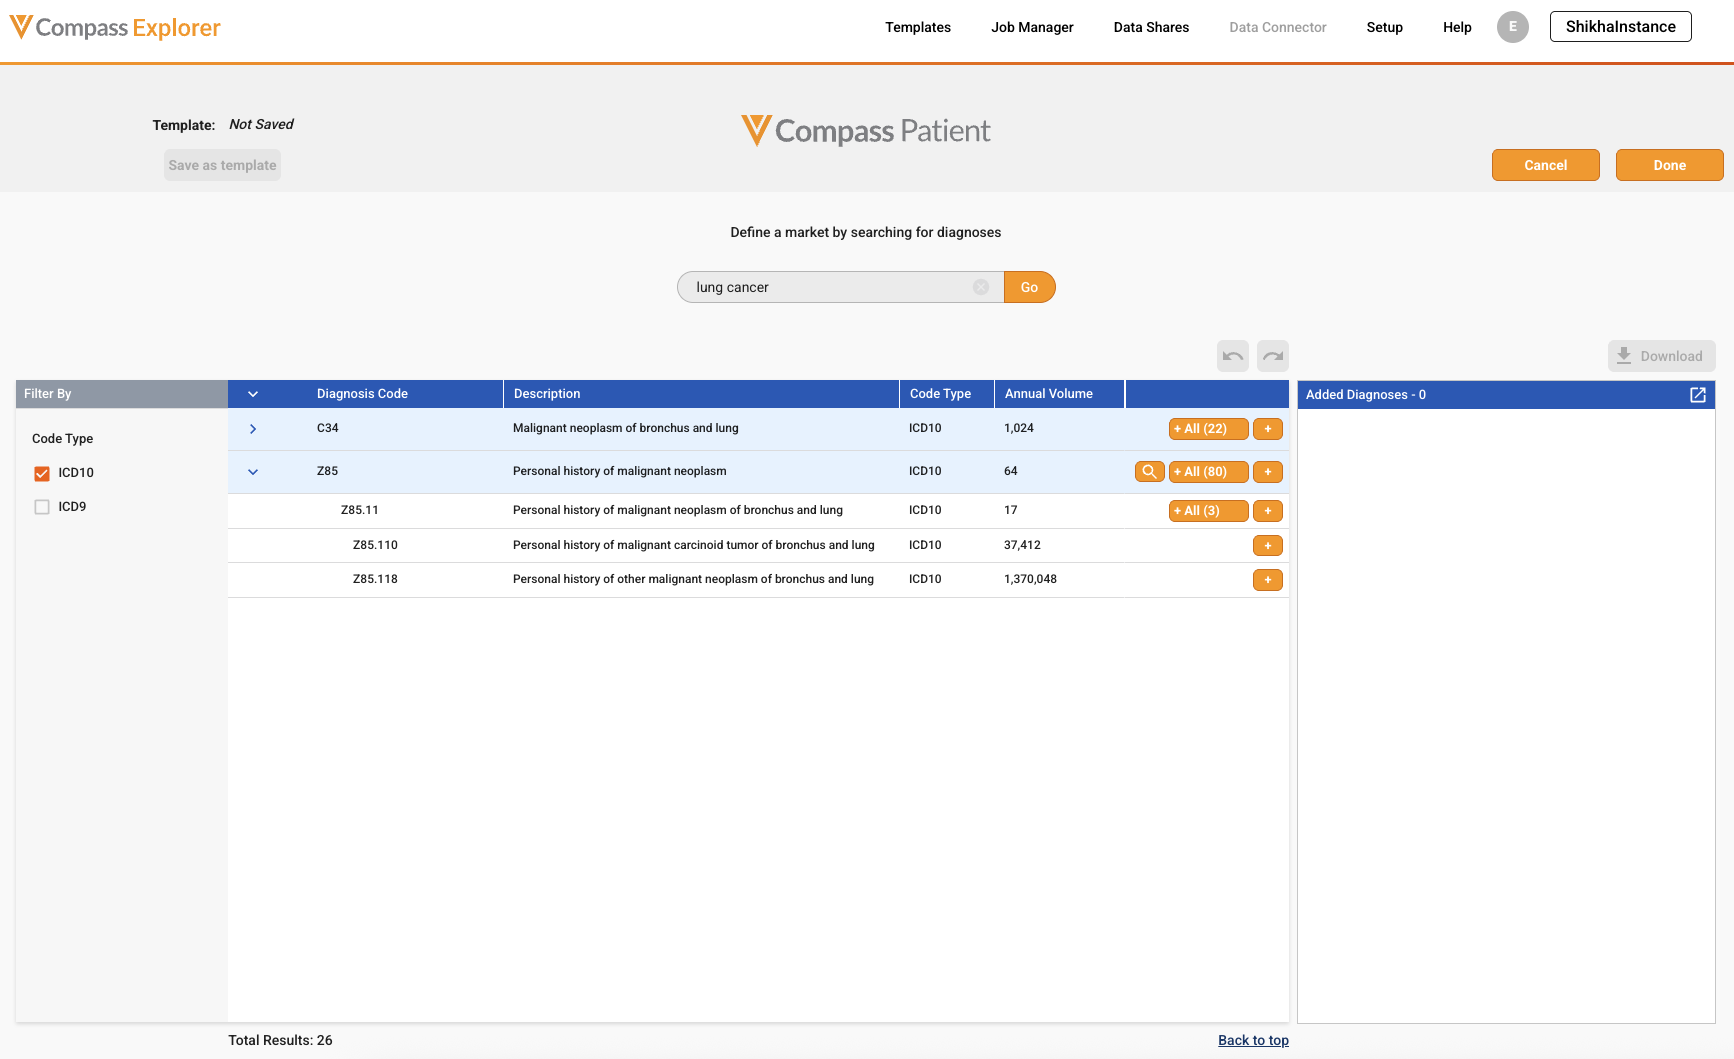
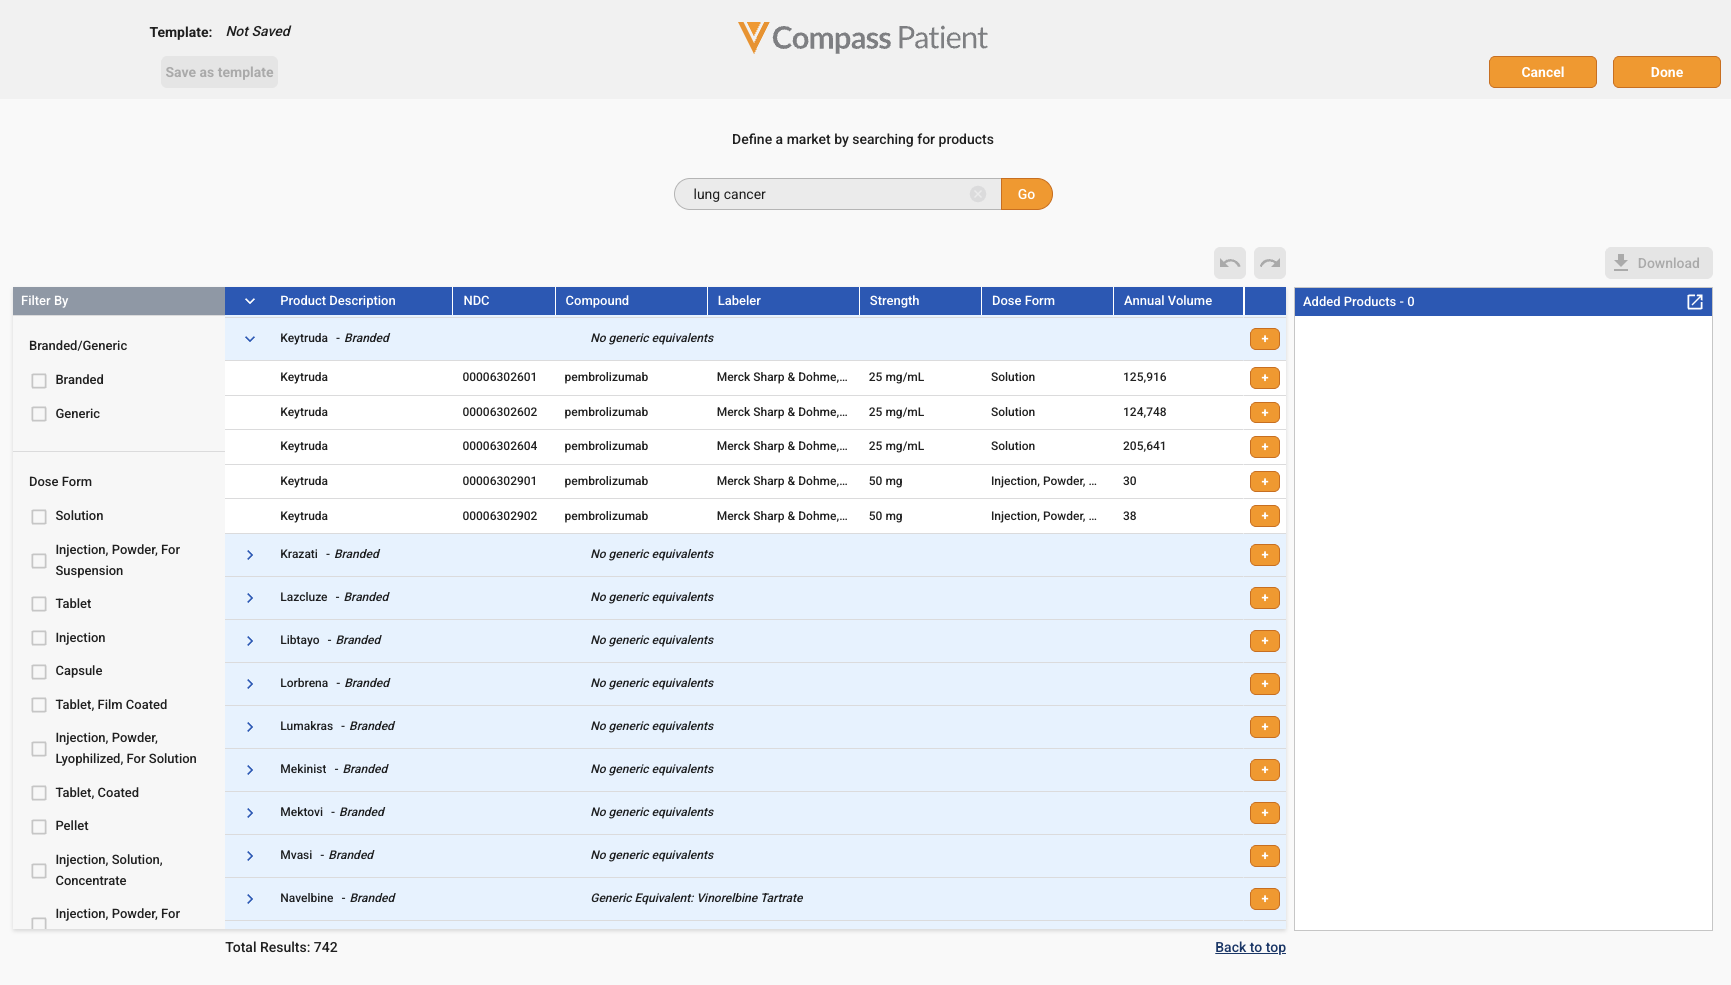
Search functionality has been improved to support searching by Disease Area. Searching by a Disease Area will return Products indicated for treatment for that disease, and Diagnosis Codes associated with that disease. This makes it quick and easy to generate a broad market basket with one search term.
Navigate to the Query Builder in Compass Explorer and search for a diagnosis code or product. Enter the name of the desired disease area to return the full list of products or diagnoses.
Veeva has pre-built mappings to translate a high-level Disease Area search into a comprehensive list of results, making the search easy and reliable. Product Disease Areas are available for products that have over 100 claims, while Diagnosis Disease Areas are available for over 40,000 codes. A list of all Disease Areas is available in our Data Dictionary.
Compass Data Connector Delivery Metrics
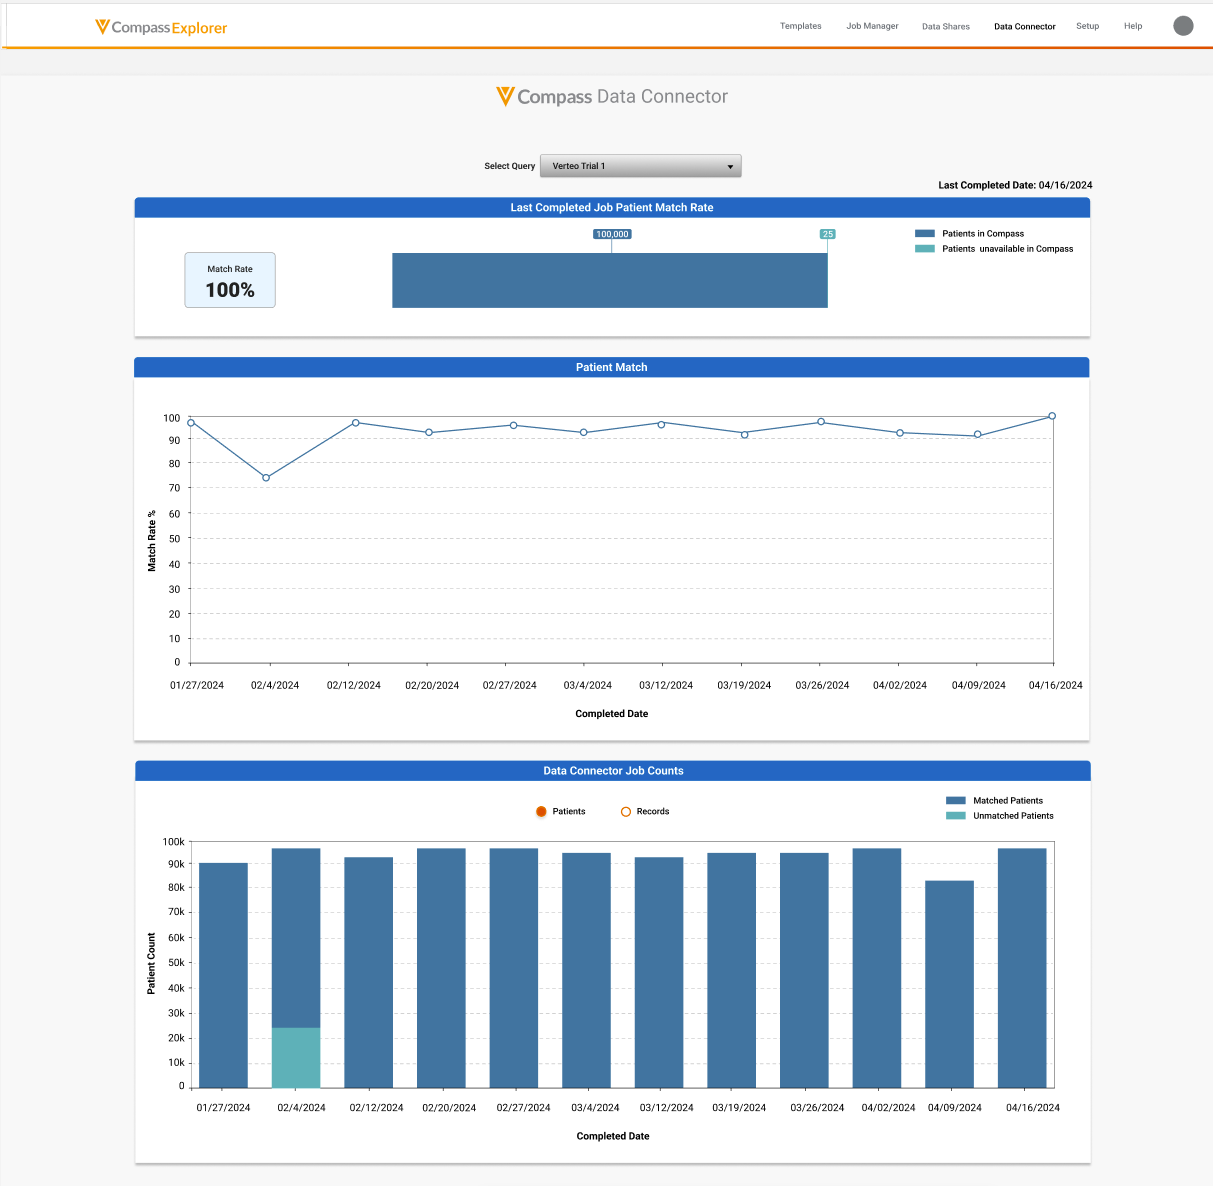
Customers who license Compass Data Connector will be able to view key stats on their deliveries right in Compass Explorer. They will now be able to:
- Track deliveries over time by each Compass Data Connector feed
- See match rates between their data and Veeva claims data in deliveries over time
- Have ease of visibility into the counts of patients and records in each delivery
Data Connector supports the linking of your Genomics, Lab Results, and Specialty Pharmacy datasets to Compass claims. Veeva works directly with the Data Partner of your choice to ingest the data, standardize and cleanse it with our rigorous quality standards, and deliver it back to you enriched with Compass Patient IDs. Data can be linked to Compass Patient data, while maintaining HIPAA compliance.
Compass Prescriber & National
Compass Prescriber Disease Area Search
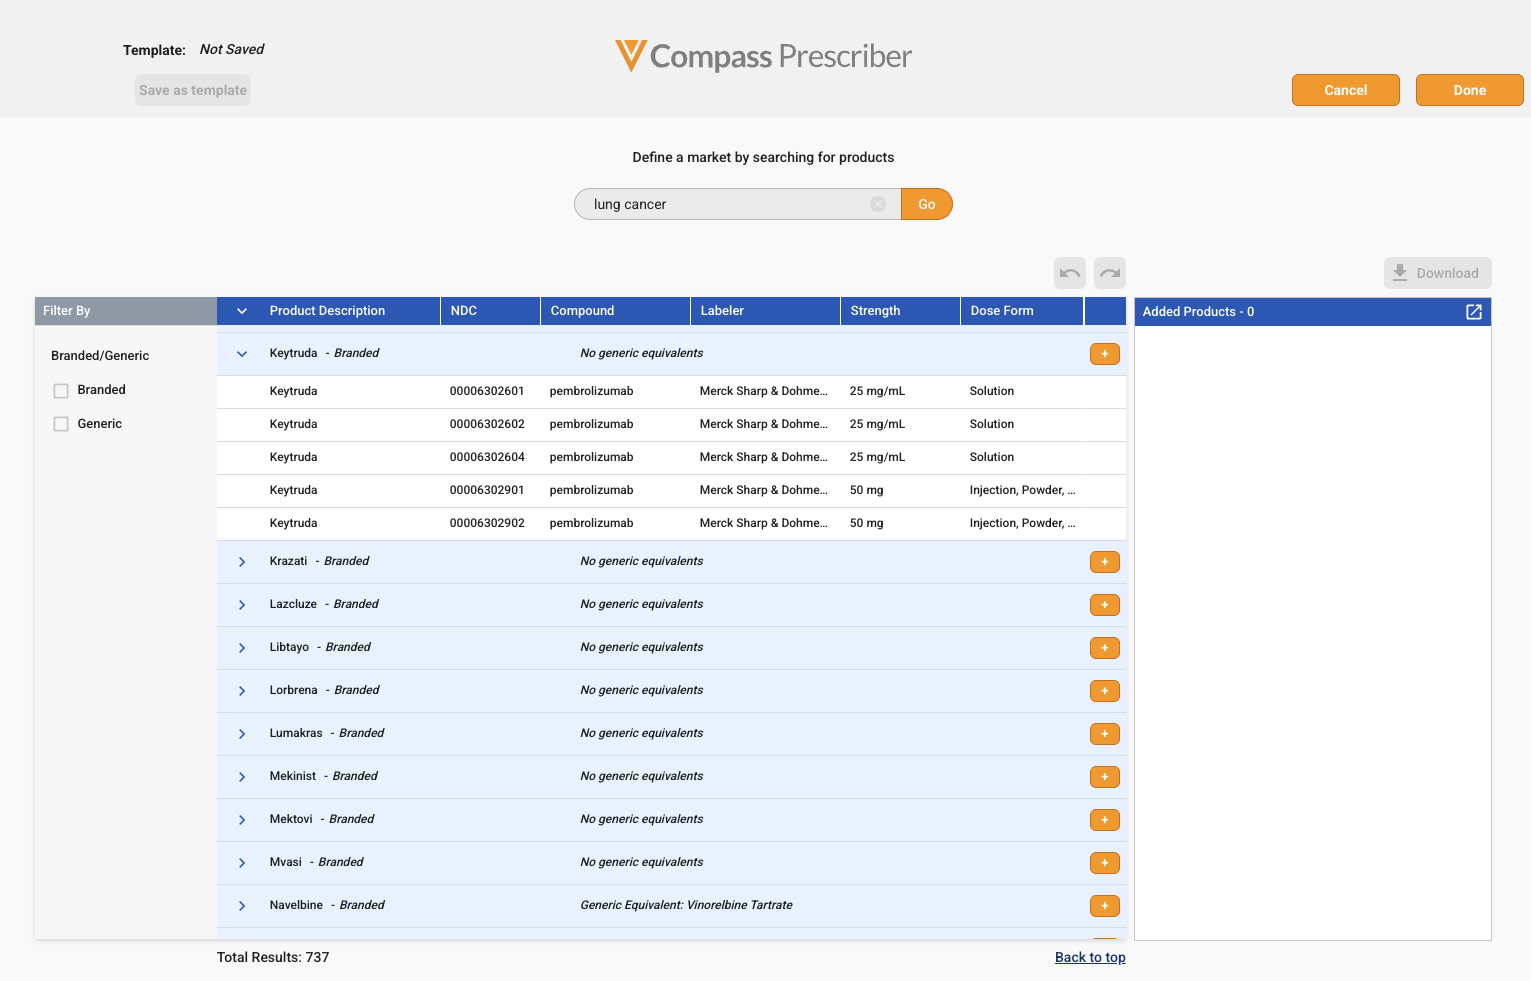
Search functionality has been improved to support searching by Disease Area, which will return Products indicated for treatment for that disease. This makes it quick and easy to generate a broad market basket with one search term.
Navigate to the product search in Compass Prescriber. Enter the name of the desired disease area to return the full list of products.
Veeva has pre-built mappings to translate a high-level Disease Area search into a comprehensive list of results, making the search easy and reliable. Product Disease Areas are available for products that have over 100 claims. A list of all Disease Areas is available in our Data Dictionary.
Compass National Weekly Projection Visualizations
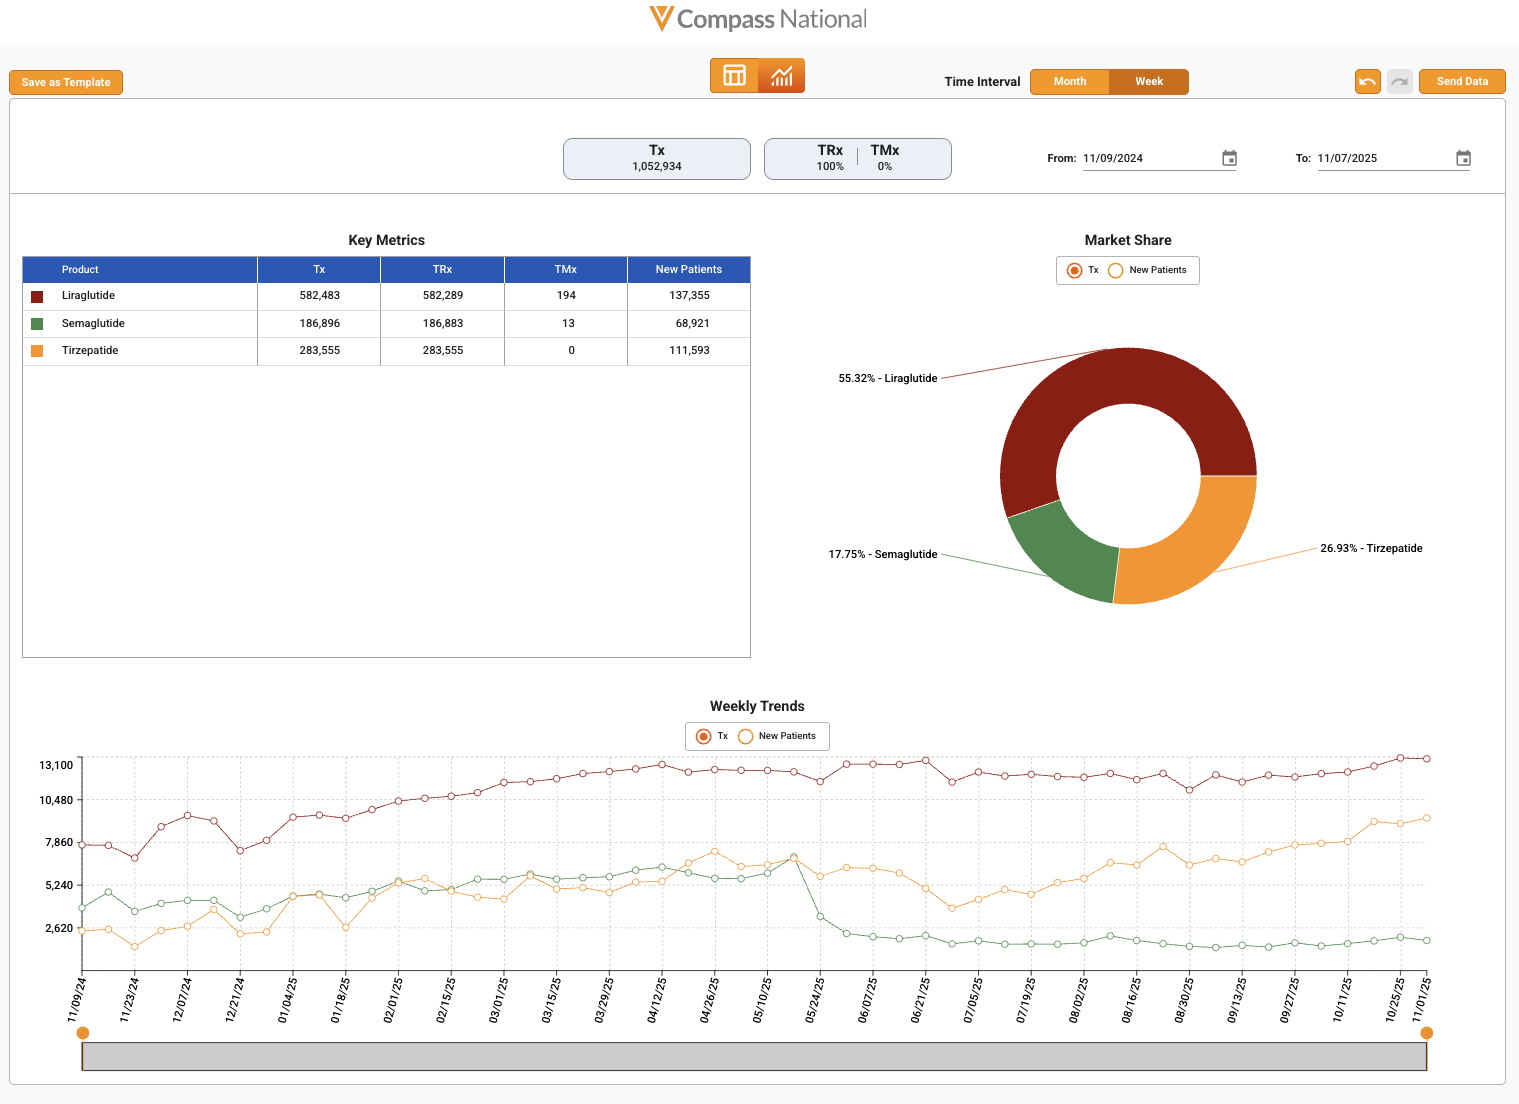
We are adding weekly projection visualizations for National in Compass Explorer, which will be published on December 18th, 2025. All the tables and visuals within National will now support both Weekly and Monthly.
Weekly projected visuals enable users to gather key market insights at a glance, without needing to pull data. Users can toggle between over 3 years, or 150+ weeks, of data. Weekly projections offer a more granular lens for seasonality and trending within a market, and earlier visibility into brand performance for all metrics. For example you can more clearly see the impact of an event or holiday on brand volume.
Below is an example of Weekly visualizations.