On This Page
Overview
Veeva Compass Prescriber allows you to pull projected prescriptions and procedures at the Prescriber and Zip level. Using Compass Prescriber, you can quickly visualize and pull Prescriber (HCP and HCO) level projected data or Zip level projected data for your products of interest.
Building a Prescriber Query
Getting Prescriber & Zip Projected Data involves the following:
- Products - Define your products of interest for your data deliverable
- Time Interval - Define whether you would like weekly, monthly, quarterly, or yearly projected data
- Time Frame - Select the time range of data you would like for prescriber visualizations or your data deliverable
- Data Type - Define whether you would like Prescriber or Zip level projected data For Prescriber data, you also have the ability to filter your prescriber list based on prescriber volume or the top HCPs for your market and time frame of interest
- Delivery - Select the delivery format and location for your data deliverable
- Review & Submit - Review the selected market, time frame, filters, and delivery prior to submitting your query

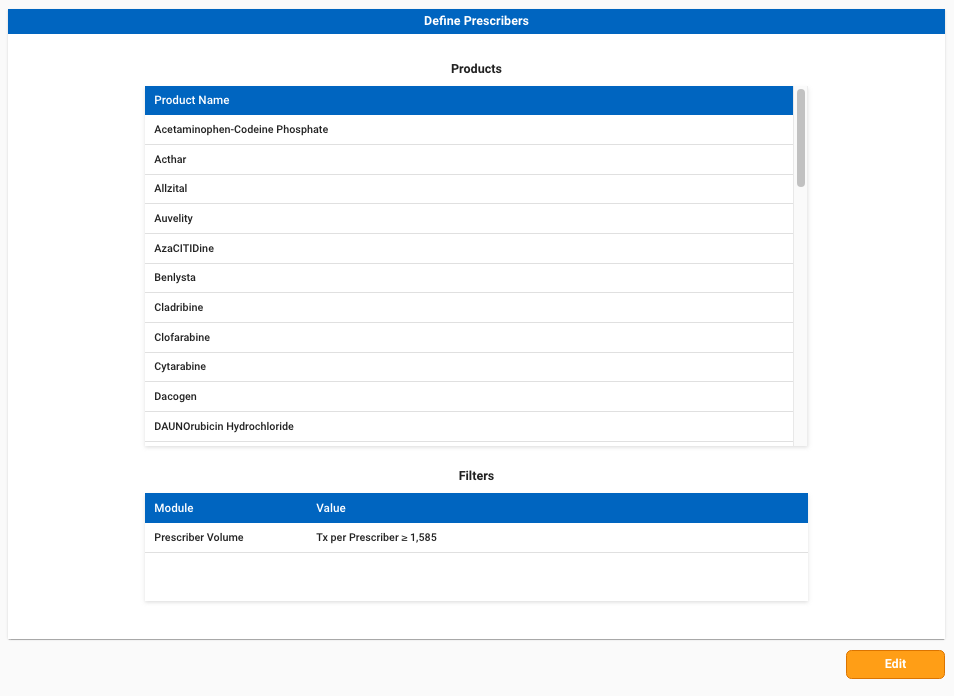
Define Prescribers
The Define Prescribers step allows you to select products, a time interval (week, month, quarter, or year) and time frame, toggle between Prescriber or Zip level data, and filter your prescriber (HCP and HCO) list based on your market. For Prescriber level data, this step includes modules to visualize and filter by prescriber volume, or to view the list of top HCPs for your market.
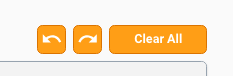
To undo and/or redo actions that you have taken within this step, use the undo and redo buttons at the upper-right of the query area. You can also clear out your entire query by clicking on Clear All.
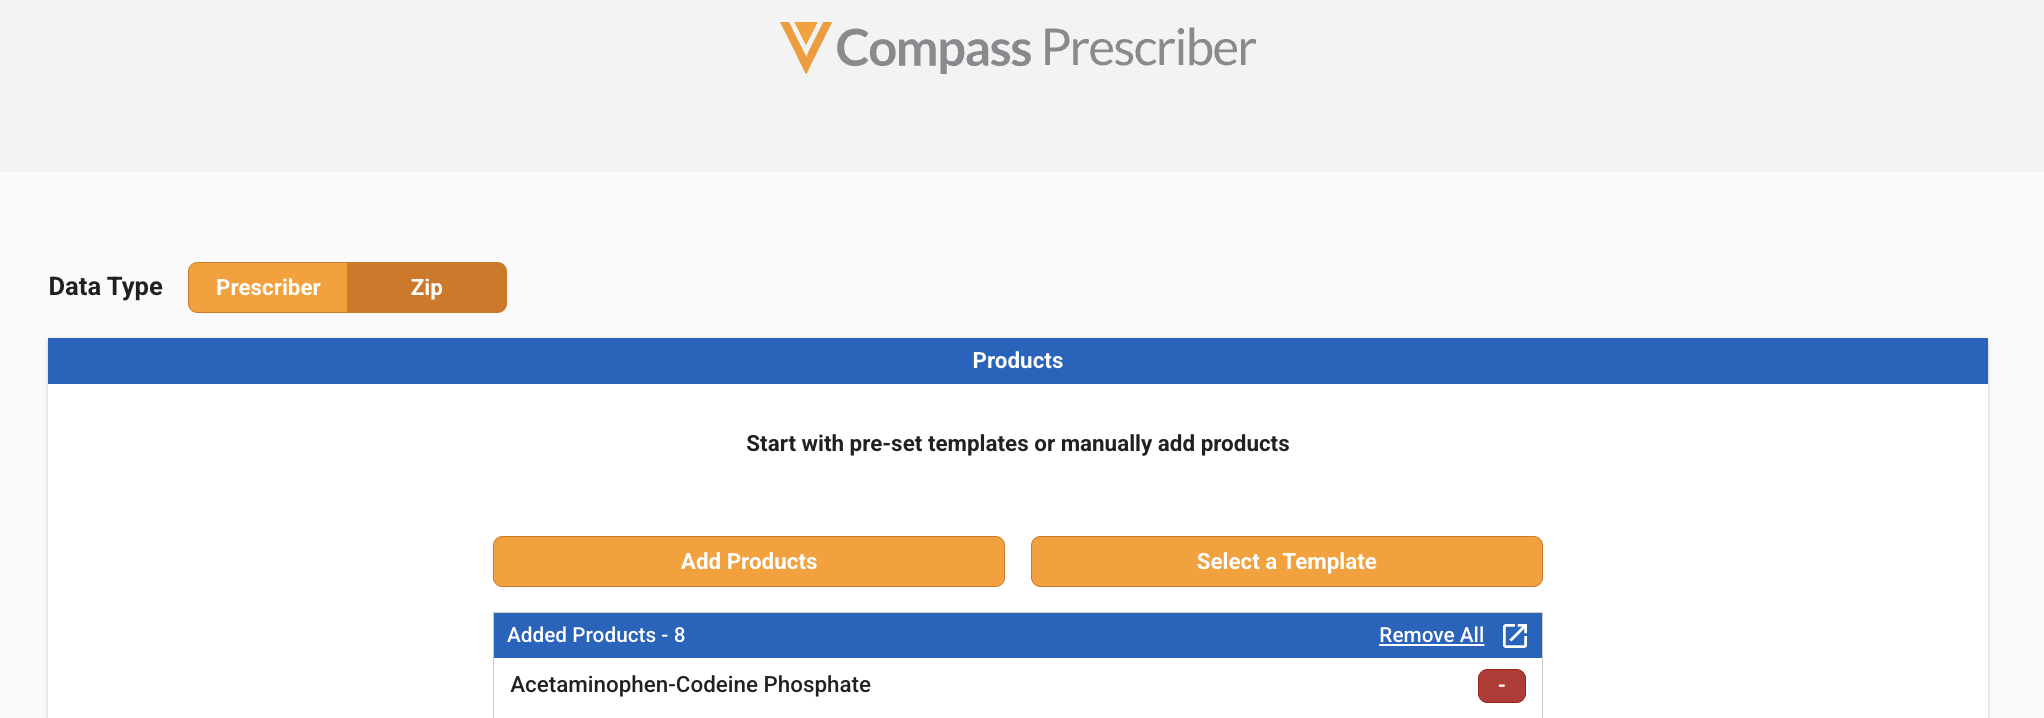
Select Products
To start building a query, select your products of interest. You may use the Code Searcher to search for specific codes, or you can choose to utilize a query template containing a list of predefined codes.

Once codes have been added to the product list, you may view the detailed list of codes by clicking the Expand button.
From the expanded code list, you can review and/or remove your added codes. Click on the Collapse button to close.

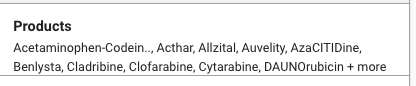
A summary of the products that you have added to your query are displayed in the Products section of the Filters.
Code Searcher
Code Searcher is used to search for specific products to add to your query. To use Code Searcher, click on the Code Searcher button (magnifying glass icon) within the Select Products pane.

From the Zip data page, you can also click on the “Add Products” button to use Code Searcher.
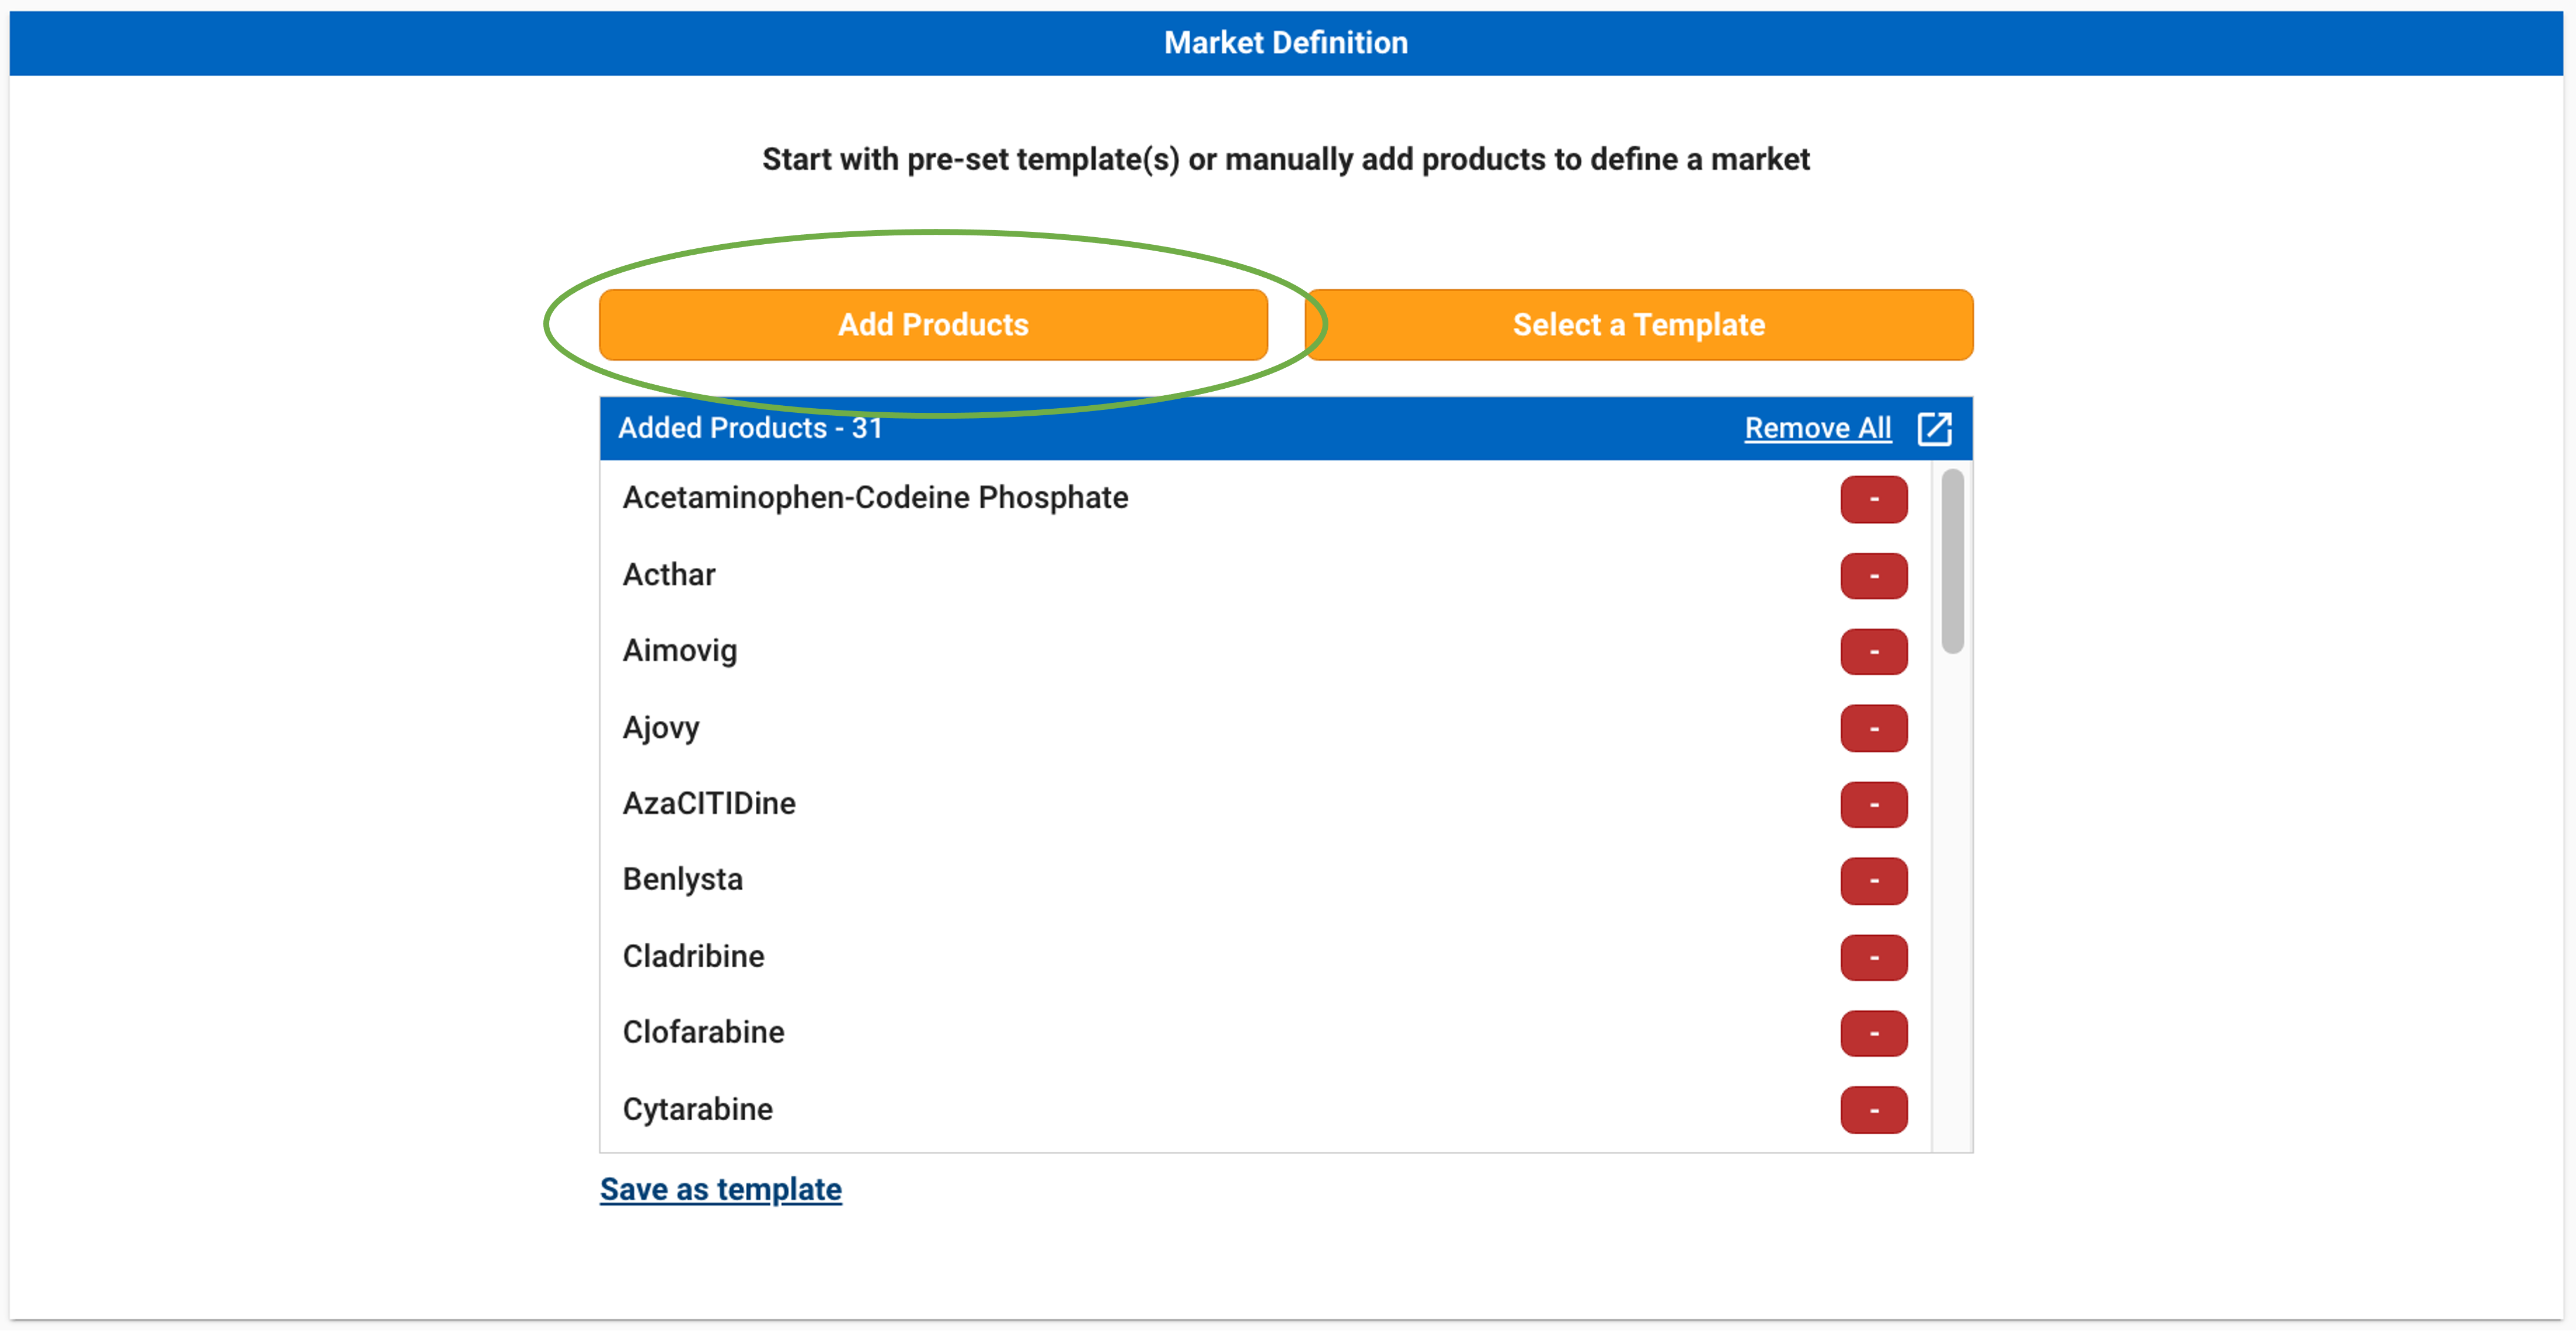
This will open the Product Code Searcher. Refer to Products for more information on how to search for and add products. Note that products are added at the brand-level for Compass Prescriber.
Templates
You can also add products to your query by using query templates. Templates can be created and managed in the Templates tab, or from a list of codes added to a query. See Query Templates for more information on creating and managing templates.
To add templates to your product list, click on the templates button (notepad icon) within the Select Products pane.
From the Zip data page, you can also click on the “Select a Template” button to add templates.
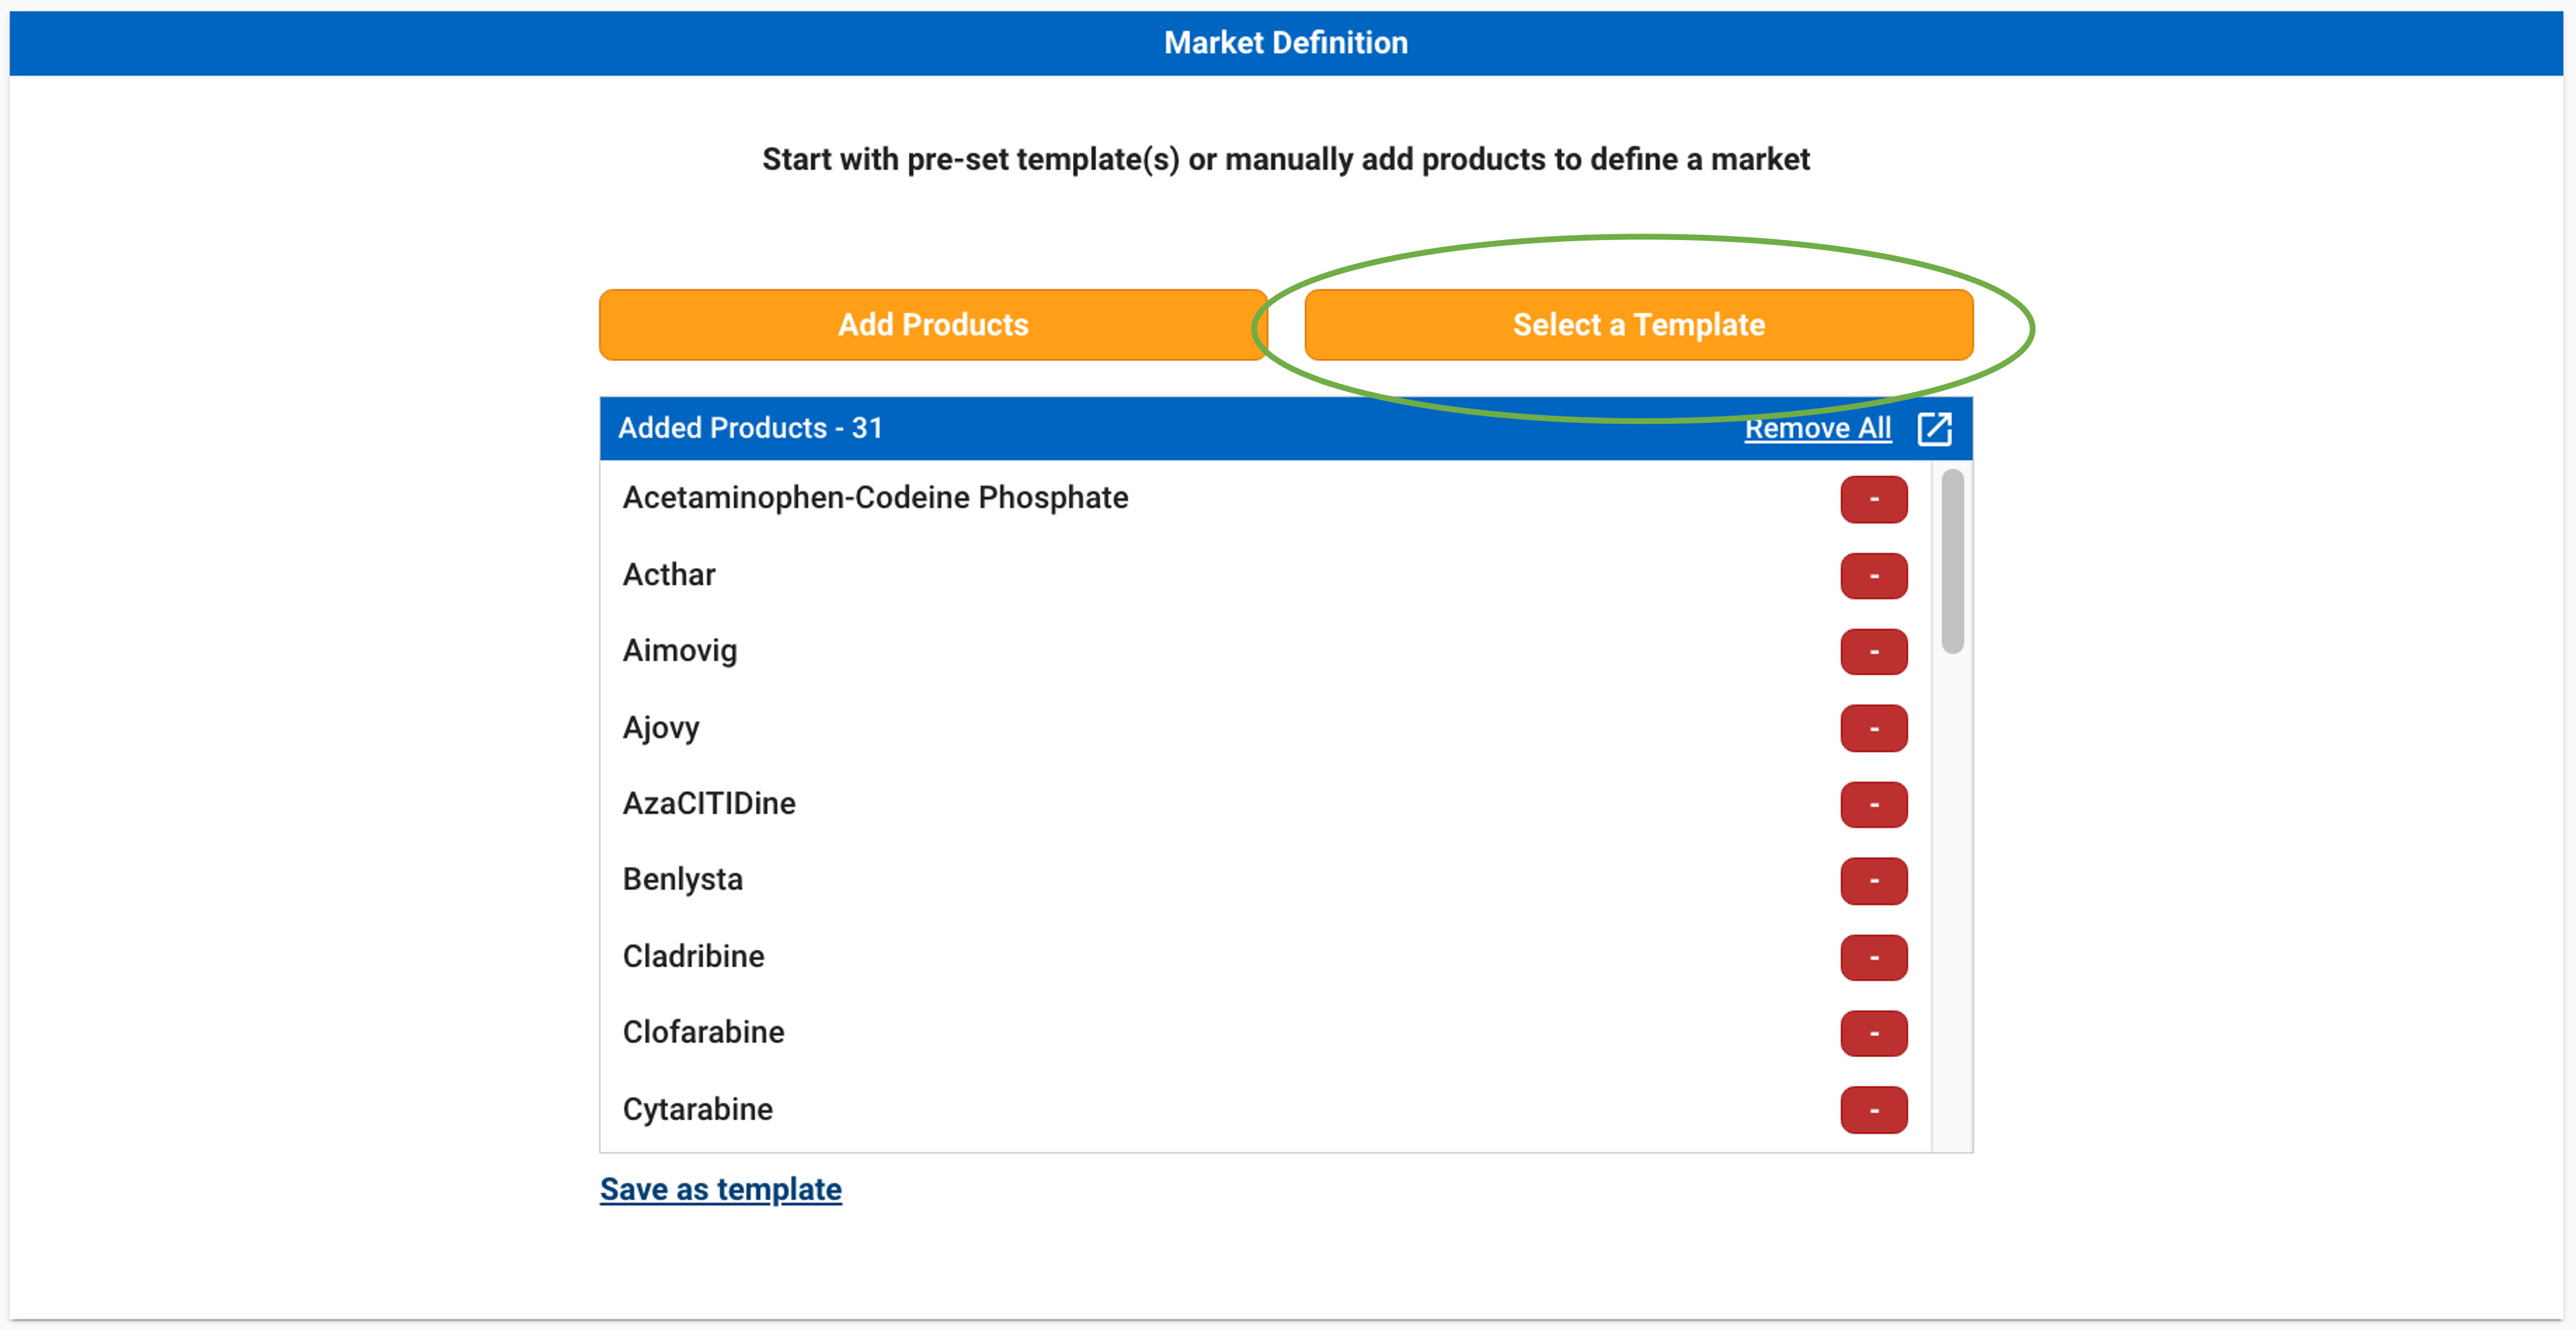
This will open a new window where you can select the template(s) you would like to add. To exit the window without applying any changes, click “Cancel”.
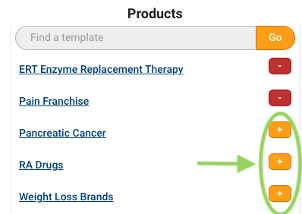
Use the search bar to search for a specific template. To preview the template, click on the template name. This will open a new window with the details of the codes in the template.
You can add a template by clicking on the + button next to the template name. You may add more than one template at a time. To deselect a template, click the - button.
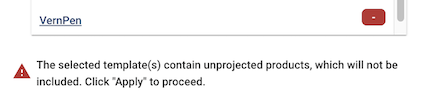
Note that templates are compatible across all Compass products (including Compass Patient and Pathway). Some products that are supported in Compass Patient and Pathway are not supported in Compass Prescriber and Compass National. When adding a template that contains products that are not supported, a warning message will appear that the selected template contains unprojected products. This means that only the products that are supported in Compass Prescriber and Compass National will be added to the query.
Once you have finished selecting your templates, click Apply. This will apply all the selected templates and add the corresponding products. You may then refine your products as needed by adding or removing additional products via Code Searcher.
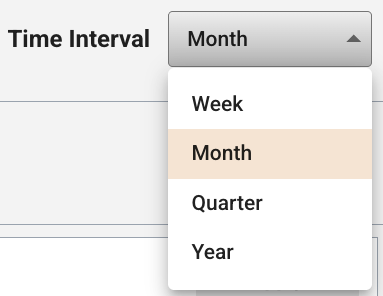
Time Interval
The Time Interval pane allows you to select whether you would like to view weekly, monthly, quarterly, or yearly data. If Month is selected, you will be able to view prescriber volume and top HCPs based on monthly projections. If Week is selected, you will be able to visualize based on weekly projections. If quarter is selected, you will be able to visualize based on quarterly projections. If year is selected, you will be able to visualize based on yearly projections.
Time Frame
The Time Frame pane allows you to define the time range of interest for the transactions. For example, you may be interested in seeing prescriber projected data from the last 24 months, or the last 13 weeks.
To select a time frame, select a value from the drop-down.
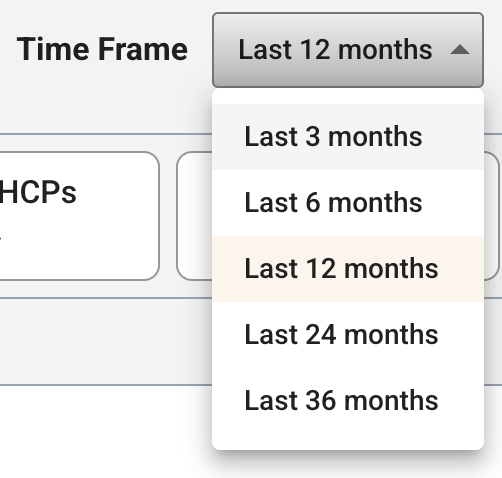
For the Week time interval, the options are: Last 13 weeks, Last 26 weeks, and Last 52 weeks.
For the Month time interval, the options are: Last 3 months, Last 6 months, Last 12 months, Last 24 months, and Last 36 months.
For the Quarter time interval, the options are: Current quarter, Last 5 quarters.
For the Year time interval, the options are: Current year, Last 2 years, Last 3 years.
You can toggle the time frame at any time in the Define Prescribers step, or utilize a custom time frame in the Delivery step.
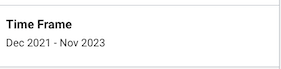
The dates that will be provided in the query are displayed in the Time Frame section of the Filters.
Data Type
The Data Type pane allows you to specify whether you would like to receive projected data on a Prescriber or Zip level.
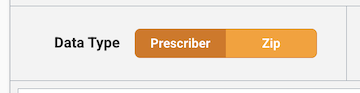
If Prescriber is selected as the Data Type, you will continue building your query in the Define Prescribers step and move on to applying module filters, if desired. Refer to “Module Filters” for more information on filtering prescribers based on volume.
If Zip is selected as the Data Type, you will be taken to the Zip data page where you can update your products and time frame if needed, select a delivery schedule and options, and submit your Zip data pull.
Note that you can switch between the Prescriber and Zip data types at any point using the toggle. Any selected products and time frame will be carried over. If any prescriber module filters were applied, they will be cleared out if the products or time frame is changed.
Module Filters
Prescriber Volume Module
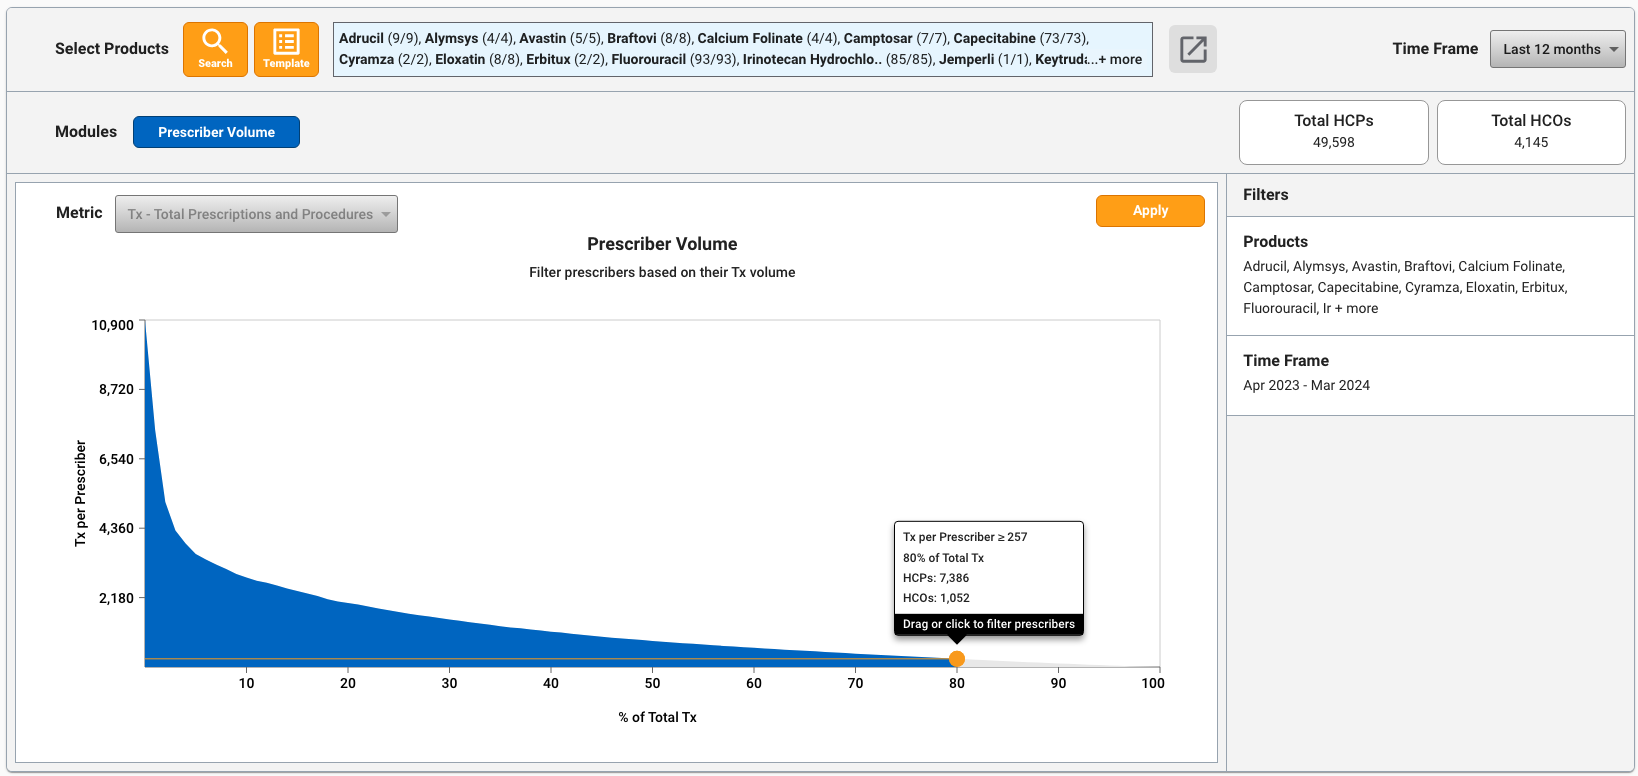
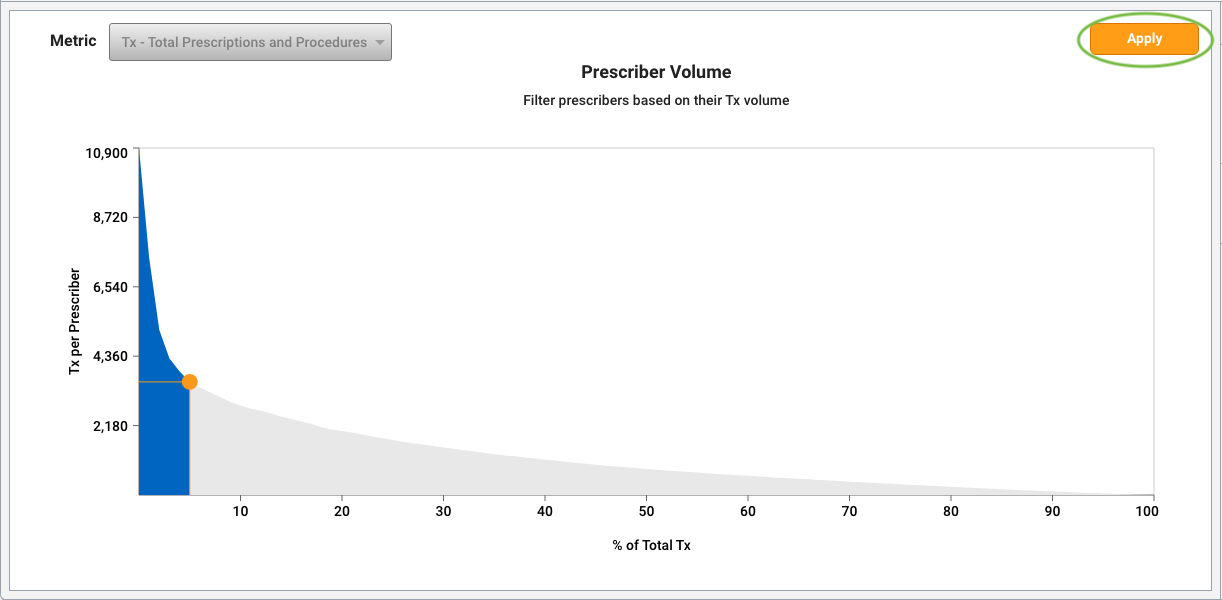
Upon selecting at least one product and a time frame, a visualization of the prescriber volume distribution will be automatically generated. The prescriber volume visual displays the total prescriptions and procedures (Tx) or New Patients per prescriber, relative to the percentage of the total Tx/New Patient volume that those prescribers account for. In addition, the count of total HCPs and HCOs for the selected products and time frame is shown.
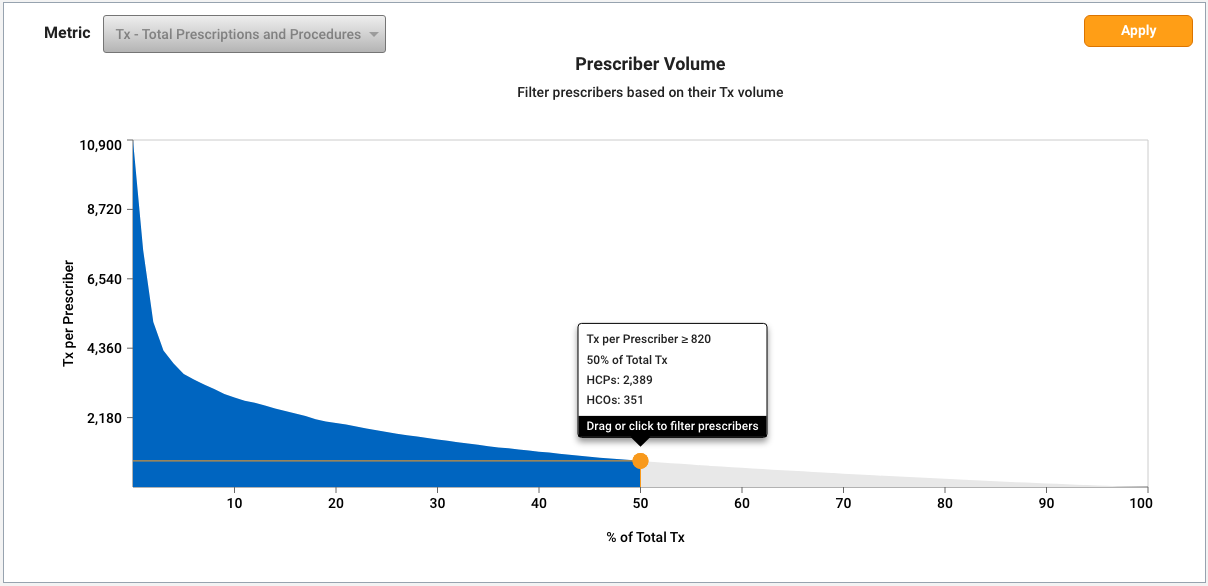
By default, the prescriber volume visual will show distribution for Tx. You can select the metric (Tx or New Patients) by using the “Metric” drop-down in the visual.
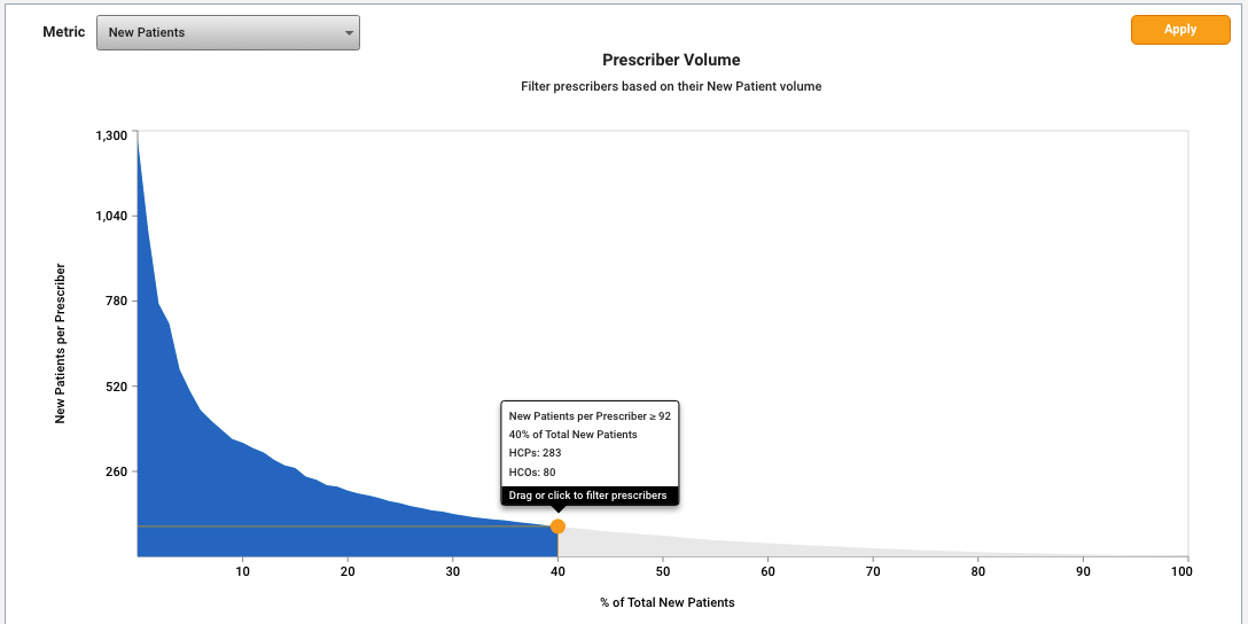
This visual is updated dynamically based on the products and time frame that are selected, and allows you to filter the prescribers provided in your query based on their Tx or New Patients volume.
For example, in the visual shown below, prescribers with a Tx volume that is greater than or equal to 820 (comprised of 2,389 HCPs and 351 HCOs) make up the top 50% of the total Tx volume for the selected products and time frame.
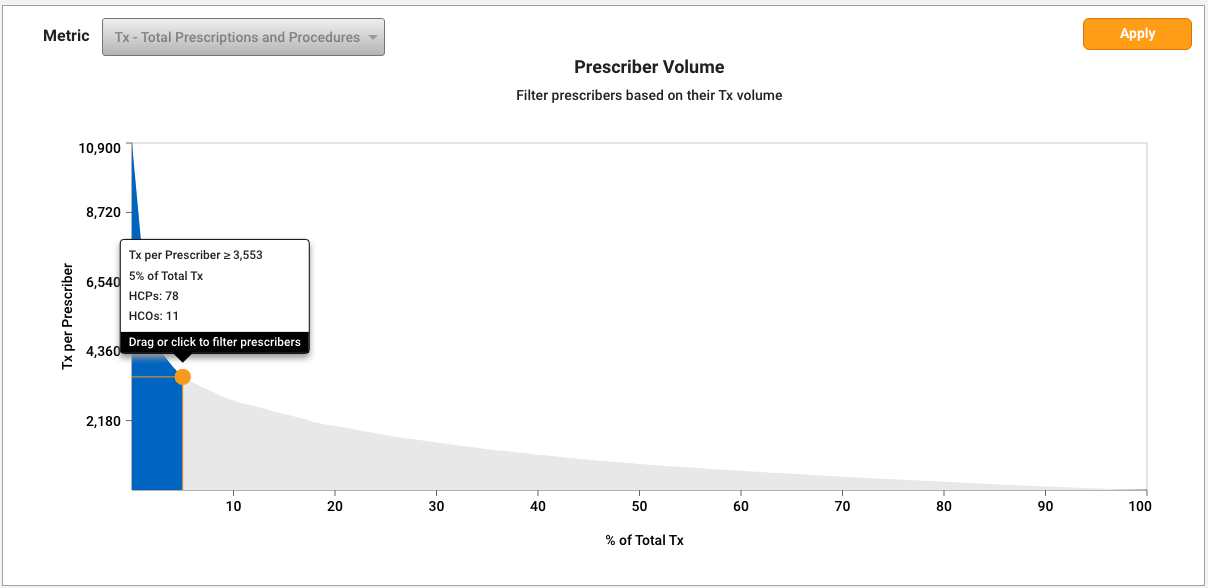
For the same set of products and time frame, prescribers with a Tx volume that is greater than or equal to 3,553 (comprised of 78 HCPs and 11 HCOs) make up the top 5% of the total Tx volume.
You can hover to explore the distributions of prescriber volumes and market percentages, and then click to move the point to another part of the graph.
You can also drag and drop the orange point to move it to another part of the graph.
Once you have determined the volume that you would like to use to filter your prescribers, click Apply.
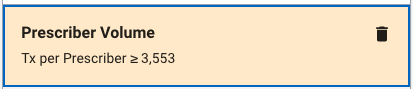
This will filter your query to only return prescribers with total Tx or New Patients volume greater than or equal to your specified threshold. For example, if you filter on Tx ≥ 3,553, this means that only prescribers with 3,553 or more Tx across the selected brands and time frame will be returned.
You can update this filter at any time by moving the point, then clicking Apply again. Note that only one prescriber volume filter can be applied at a time, for either Tx or New Patients. You can also remove the filter by clicking on the trash can icon in the Filters pane.
By default, if no prescriber volume filter is applied, you will receive all prescribers with at least one transaction across the selected products and time frame.
Note that updating the products or time frame will clear out any applied prescriber volume filters, since the prescriber volume distribution is generated based on the current selections.
Top HCPs Module
The Top HCPs module allows you to see the top HCPs for your selected products and time frame, along with their treatment and patient volume. Using the Top HCPs module, you can answer key business questions such as:
- Who are the top writers in my market, and what is their treatment and patient volume?
- What specialties are my top writers?
- Where are my top writers located? You can also use this module to quickly search on and answer questions for specific HCPs of interest to support research and field activities.
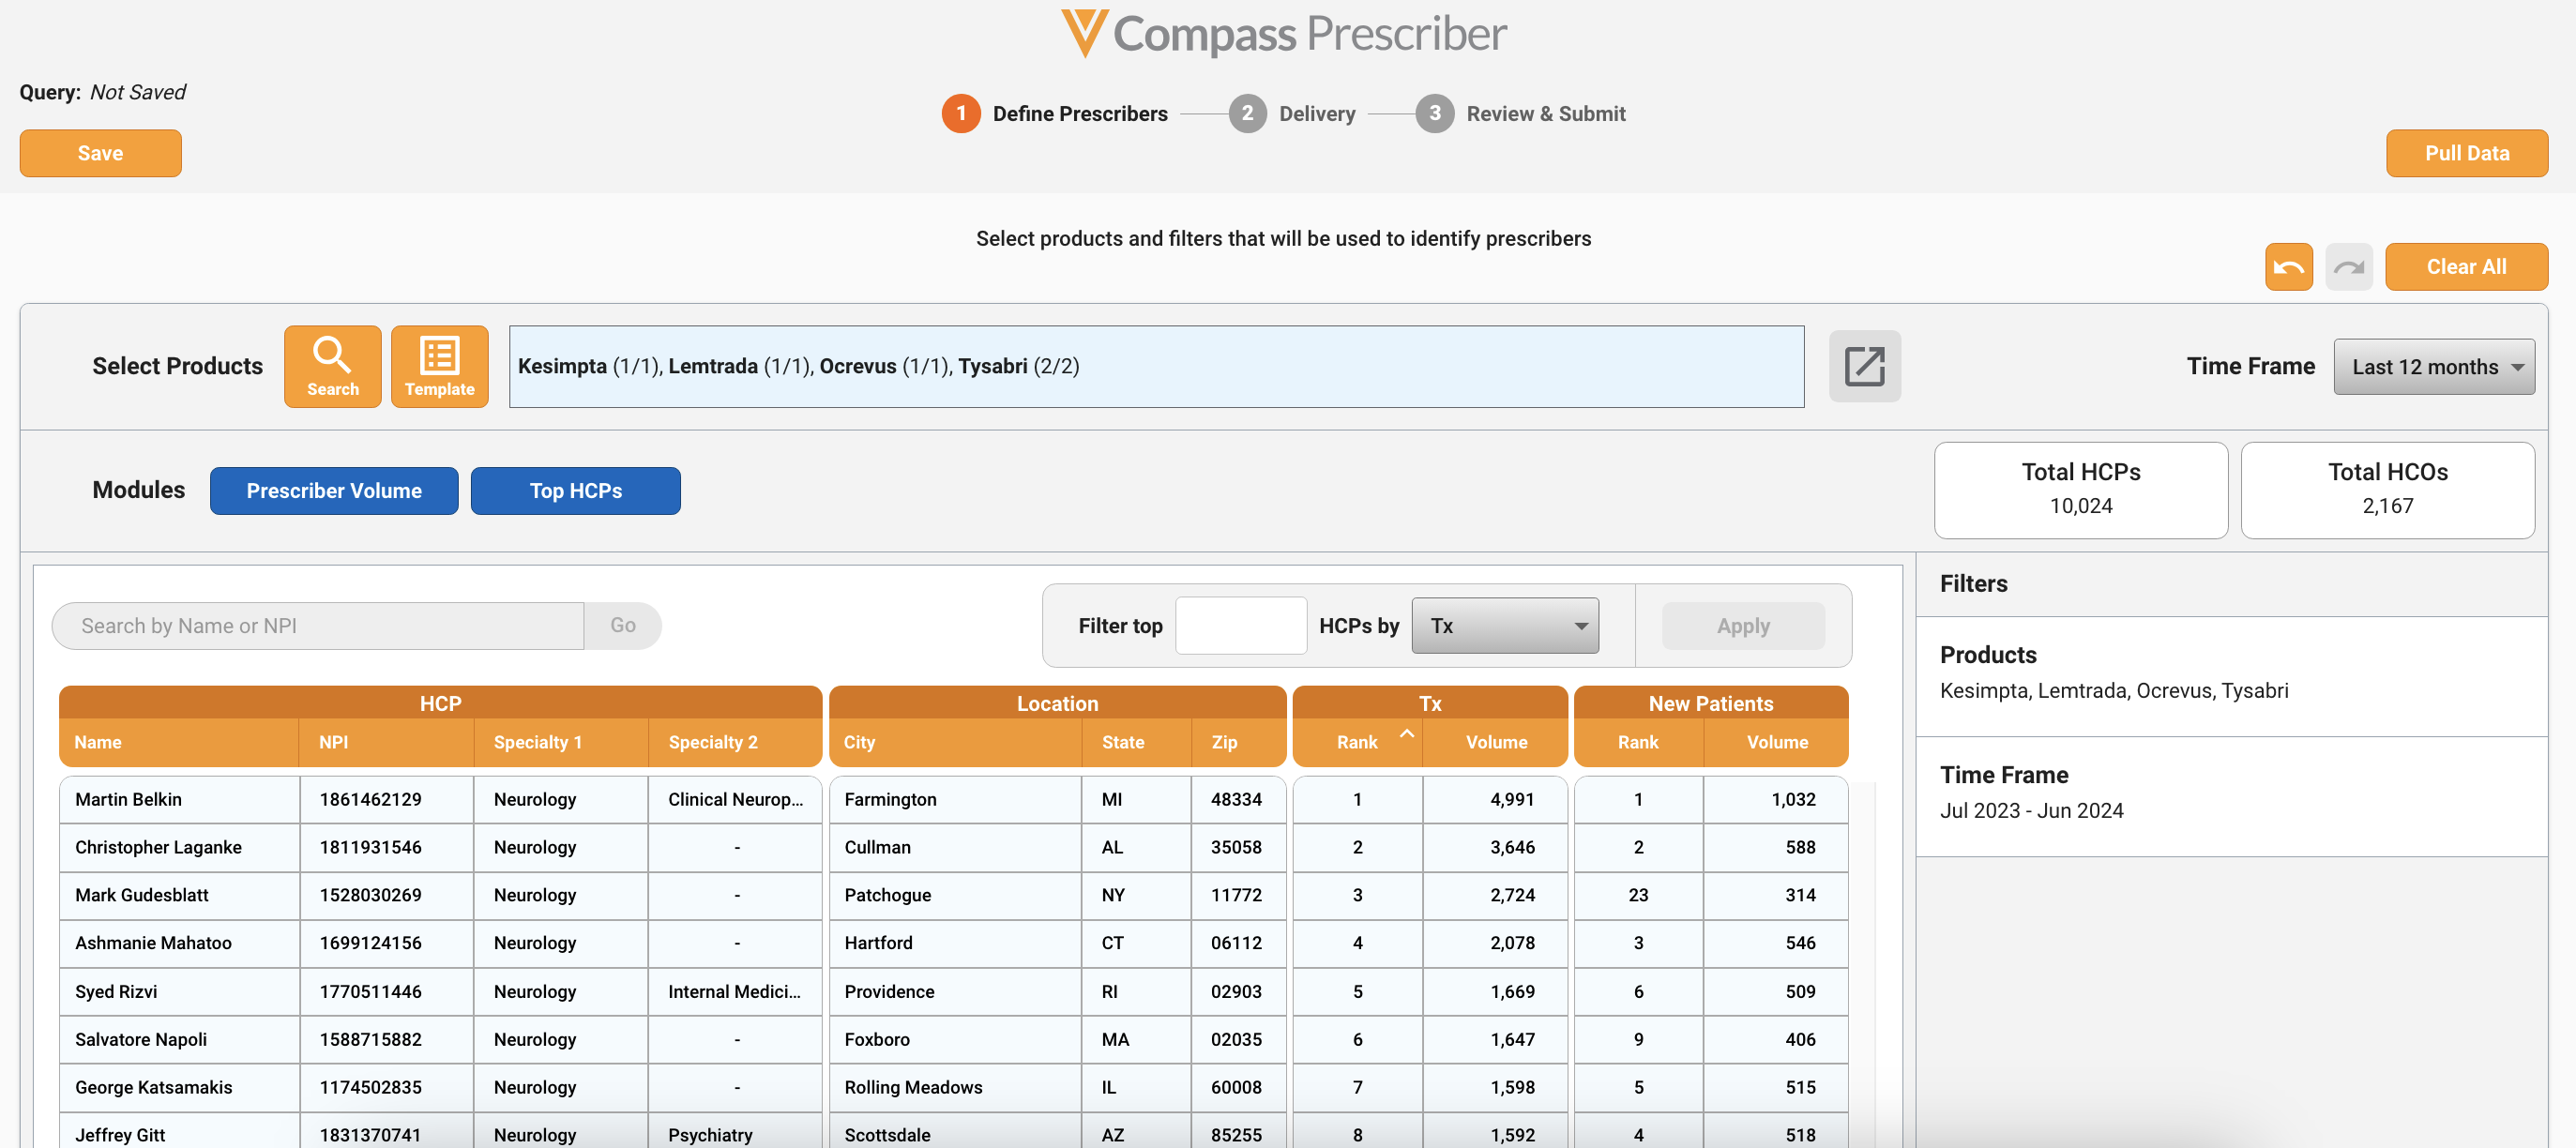
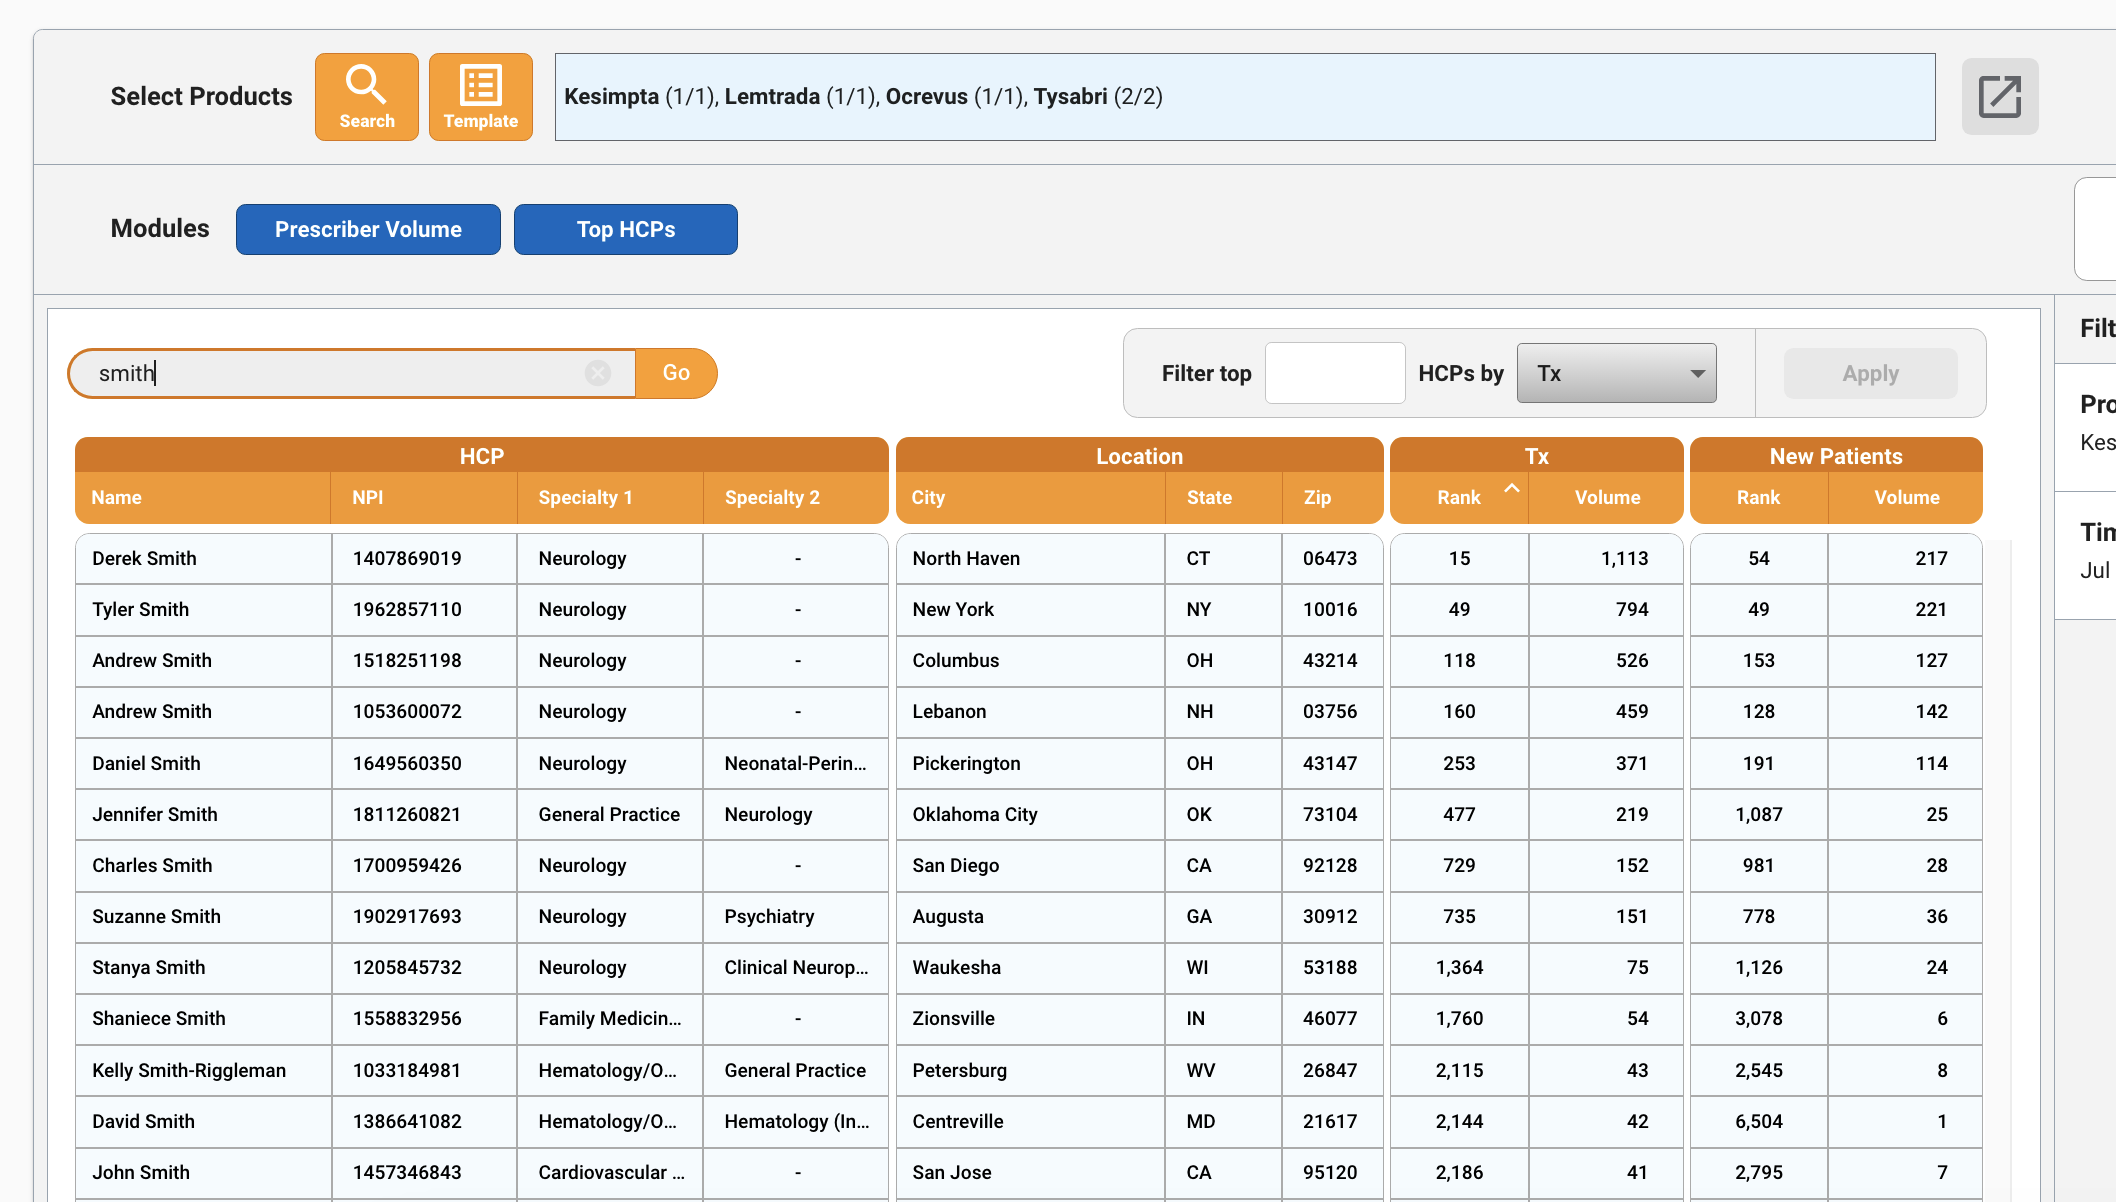
Upon selecting products and a time frame, you can view the top prescribing HCPs by toggling to the Top HCPs module. This module displays HCPs treating with the selected products and as well as any relevant information, such as NPI, specialty, and location information, and their Tx and New Patient rank and volumes over the selected time frame. In addition, you can search for specific HCPs of interest by name or NPI.
You can also filter your data output by selecting a number of top HCPs and a metric to filter by, then clicking Apply. For example, you can specify that you want to receive the top 1,000 HCPs by New Patient volume in your output.

Applying a top HCPs filter will exclude HCOs from your data output. The top HCPs filter can be used in combination with filtering on prescriber volume in order to drill down to a smaller set of HCPs. If both a top HCP and prescriber volume filter are applied, the filter that returns the smaller set of HCPs will override. The count of the total HCPs above the filters pane indicates how many HCPs will be returned in the data pull based on all applied filters.
Note that updating the products or time interval/time frame will clear out any applied top HCP filters, since the HCP list is generated based on the current selections.
Once you are done defining your prescribers, click on “Pull Data” to move on to the Delivery step.

Delivery
The Delivery step allows you to select a delivery schedule, a time frame for the data, as well as to specify where the data will be delivered and in what format.
Delivery Schedule
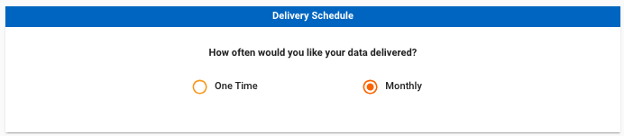
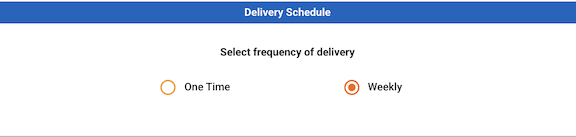
Delivery Schedule allows you to select how often you would like your data delivered. The delivery schedule options for Compass Prescriber are:
- One Time - A one time pull provides a single delivery (either with weekly, monthly, quarterly, or yearly projections) with the selected products, filters, and time frame.
- Monthly - A monthly job allows you to receive the latest set of monthly, quarterly, or yearly projections on a recurring monthly basis. Monthly jobs are run on the 1st of each month and will include projections up until the end of the latest available month. For example, a monthly job run on April 1, 2025, will include projections up until the end of February 2025. The following monthly job, run on May 1, 2025, will include projections up until the end of March 2025. Monthly projections will report each month separately, while quarterly projections will aggregate three months together, and yearly projections will aggregate twelve months together. Quarters or years with partial data will be reported as quarter to date (QTD) or year to date (YTD).
- Weekly - A weekly job allows you to receive the latest set of weekly projections on a recurring weekly basis. Weekly jobs are run each Friday, and will include projections up until three weeks prior. For example, a weekly job run on Friday September 5, 2025 will include projections up until August 15, 2025. The following weekly job, run on Friday September 12, 2025 will include projections up until August 22, 2025.
Note that you will either see the monthly or weekly delivery schedule option based on the Time Interval selection in Step 1.
Time Frame
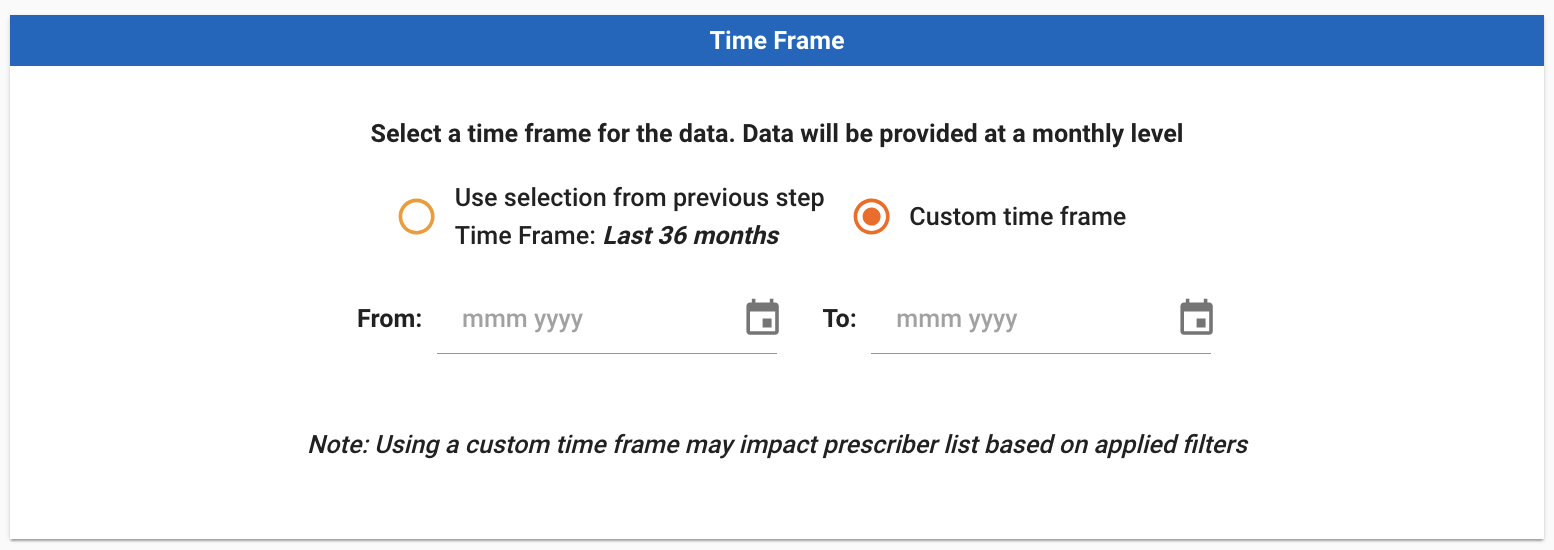
The Time Frame pane can be used to select a time range for your data. By default, the time frame that will be used for the query is the selection from Step 1 in the Time Frame section.
For one time jobs, you can opt to receive data from a custom time frame rather than using the time frame selection from Step 1. Select the “Custom time frame” option, then use the month or week calendar selectors to pick your desired time frame.
Note that for Prescriber level queries, if a prescriber volume filter was applied and a custom time frame or full refresh is selected, the prescriber volume filter will apply to the custom or full refresh time frame rather than the time frame utilized to generate the visualization. This may impact the returned list of prescribers in your data output.
For example, if you filter on Tx ≥ 4,726 using the “Last 36 months” time frame, then update your custom time frame to be 6 months, the query will only return prescribers with Tx ≥ 4,726 in the selected 6 month window, which may result in fewer prescribers in your query results.
Week Selection
For weekly jobs, you can select a range of weeks to include in your data pull. To add a starting week, click the “mm/dd/yyyy” or the calendar picker next to “From”.
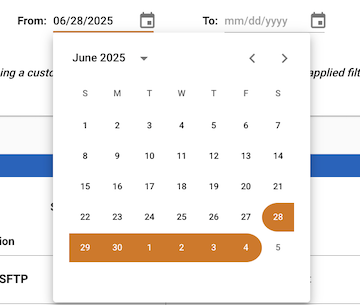
Hover over the calendar to select the week you would like to start with. For Compass projections, weeks are defined as Saturday through Friday.
After selecting the starting week, specify the ending week. To add an ending week, type or click the “mm/dd/yyyy” or the calendar picker next to “To”. Note that the “From” date must be before the “To” date.
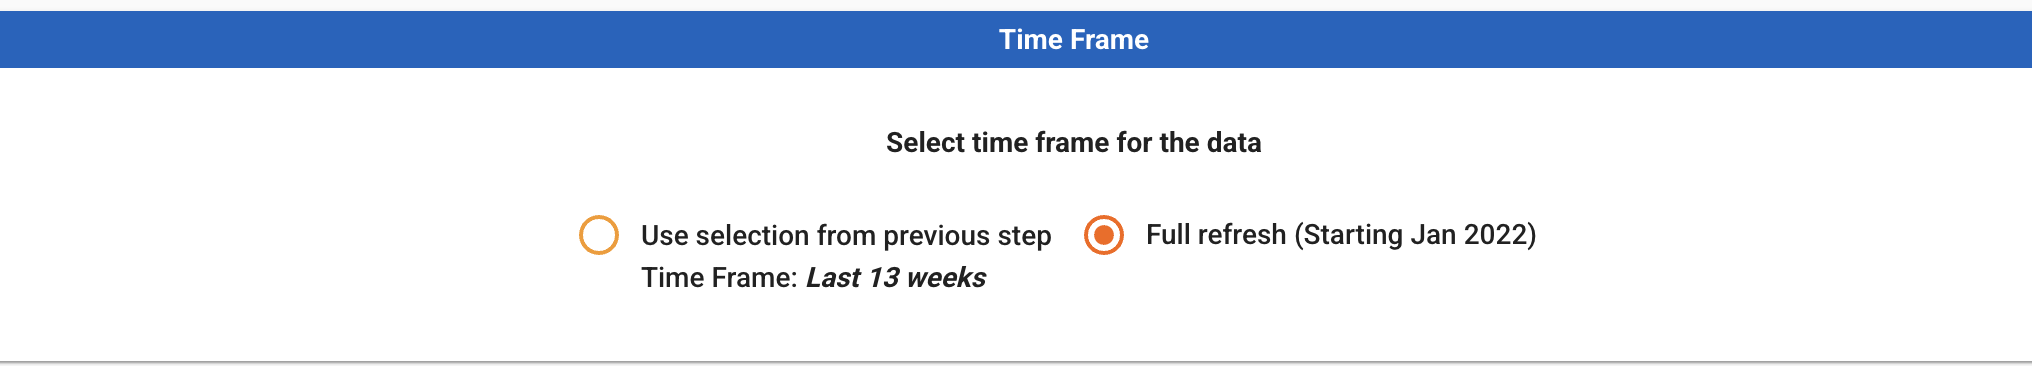
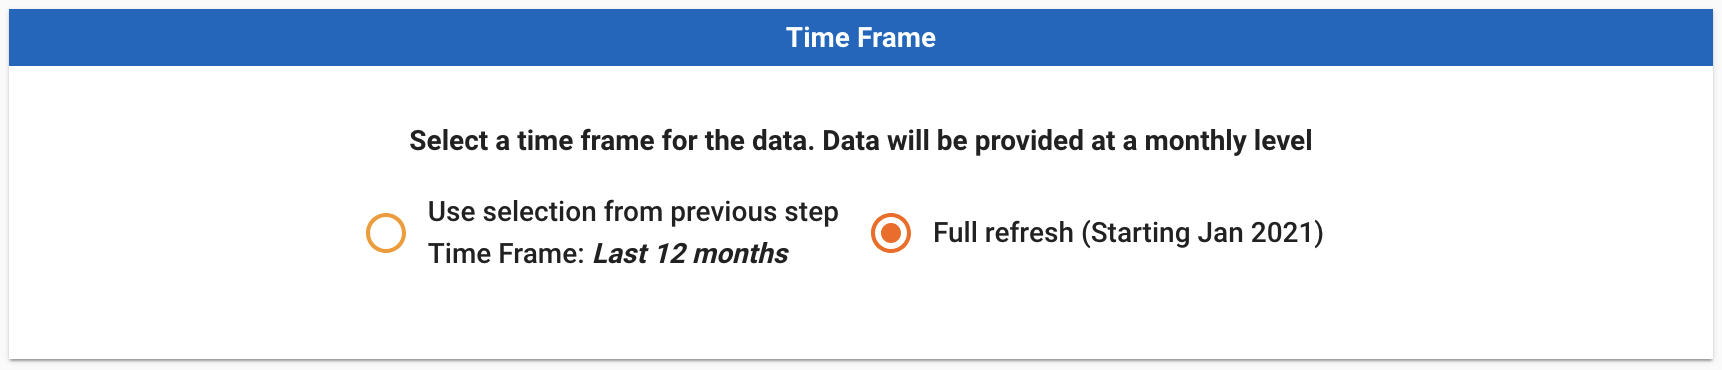
For weekly jobs, you can opt to receive a rolling time frame of data (e.g. each weekly job will provide data from the most recent 13, 26, or 52 weeks) using the selection from Step 1, or a full refresh. Full refresh means that each weekly job will provide data from January 2022 to the latest available week.
Compass Prescriber has data available starting from Jan 2022, and weekly projections are published each Thursday for three weeks prior. For example, weekly projection data up until August 8, 2025 will be made available on August 28, 2025.
Month Selection
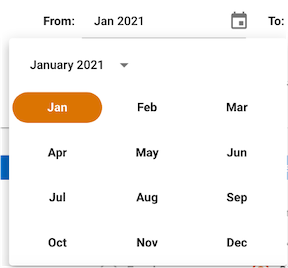
For monthly jobs, you can select a range of months to include in your data pull. To add a starting month, type the three letter abbreviation for the month (e.g. Jan, Feb, Mar) or click the “mmm yyyy” or the calendar picker next to “From”.
After selecting the starting month, specify the ending month. To add an ending month, type or click the “mmm yyyy” or the calendar picker next to “To”. Note that the “From” date must be before the “To” date.
For monthly jobs, you can opt to receive a rolling time frame of data (e.g. each monthly job will provide data from the most recent 12, 24, or 36 months) using the selection from Step 1, or a full refresh. Full refresh means that each monthly job will provide data from January 2022 to the latest available month.
Compass Prescriber has data available starting from Jan 2022, and the prior month’s projections are published on the 28th of each month. For example, April 2025 projection data will be made available on May 28, 2025.
Quarter Selection
For quarterly jobs, you can select a range of quarters to include in your data pull. To add a starting quarter, click the “qq yyyy” or the calendar picker next to “From”.
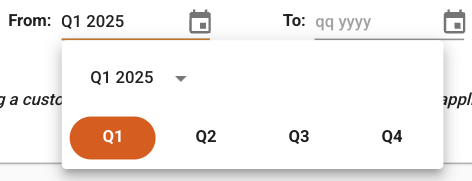
Hover over the calendar to select the quarter and year you would like to start with.
After selecting the starting quarter, specify the ending quarter. To add an ending quarter, click the “qq yyyy” or the calendar picker next to “To”. Note that the “From” date must be before the “To” date.
For quarterly jobs, you can opt to receive a rolling time frame of data (e.g. each job will provide data from the most recent 1 or 5 quarters) using the selection from Step 1, or a full refresh. Full refresh means that each quarterly job will provide data from January 2022 to the latest available quarter.
Year Selection
For yearly jobs, you can select a range of years to include in your data pull. To add a starting year, click the “yyyy” or the calendar picker next to “From”.
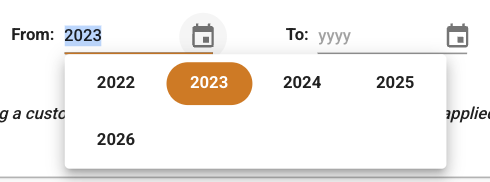
Hover over the calendar to select the year you would like to start with.
After selecting the starting year, specify the ending year. To add an ending year, click the “yyyy” or the calendar picker next to “To”. Note that the “From” date must be before the “To” date.
For yearly jobs, you can opt to receive a rolling time frame of data (e.g. each job will provide data from the most recent 1, 2, or 3 years) using the selection from Step 1, or a full refresh. Full refresh means that each yearly job will provide data from January 2022 to the latest available year.
Delivery Options
Delivery Options allows you to select your desired data delivery locations and file formats for your data. Select the delivery location(s) you would like your data to be delivered to via the checkboxes.If you have multiple configured delivery locations in Explorer, you may select more than one delivery location for your data. See Delivery Configuration for details on setting up new delivery locations.
The following delivery locations are currently available:
- SFTP is a Veeva-hosted secure file location which allows users to use an SFTP client (such as FileZilla or CyberDuck) to connect, navigate and download their data files. The SFTP option will be default selected for all queries.
- Amazon S3 allows you to deliver your data files to Amazon S3. If you have multiple Amazon S3 buckets configured for Compass delivery, you will need to select at least one bucket name from the dropdown list in addition to selecting the Amazon S3 checkbox to use this location. Users are able to select up to three Amazon S3 buckets for delivery in a single job.
- Microsoft Azure allows you to deliver your data files to Microsoft Azure. If you have multiple Azure containers configured for Compass delivery, you will need to select at least one container name from the dropdown list in addition to selecting the Microsoft Azure checkbox to use this location. Users are able to select up to three Azure containers for delivery in a single job.
- Veeva CRM allows users to deliver Veeva Compass Prescriber data directly to the field team, through powerful MyInsights content that is updated monthly. The Veeva CRM option is available for users with an active Veeva CRM MyInsights subscription. Note that CRM is only available for monthly data queries. Currently, one active monthly query can be sent to CRM MyInsights per customer.
- Vault CRM allows users to deliver Veeva Compass prescriber-level data directly to the field team, through powerful X-Pages content that is updated monthly. The Vault CRM option is available for users with an active Vault CRM X-Pages subscription. Note that CRM is only available for monthly data queries. Currently, one active monthly query can be sent to Vault CRM X-Pages per customer.
- Veeva Nitro is a data science and analytics platform that seamlessly integrates with Veeva Compass. Nitro provides faster access to your data, so you have your data ready for querying, visualizing, and reporting. The Nitro option is available for weekly and monthly projections, for users with an active Nitro subscription.
- Portal Download allows business users without access to an SFTP location to download their data directly from the Portal in an Excel format. Note that each tab within the Excel file will be truncated at 600K rows.
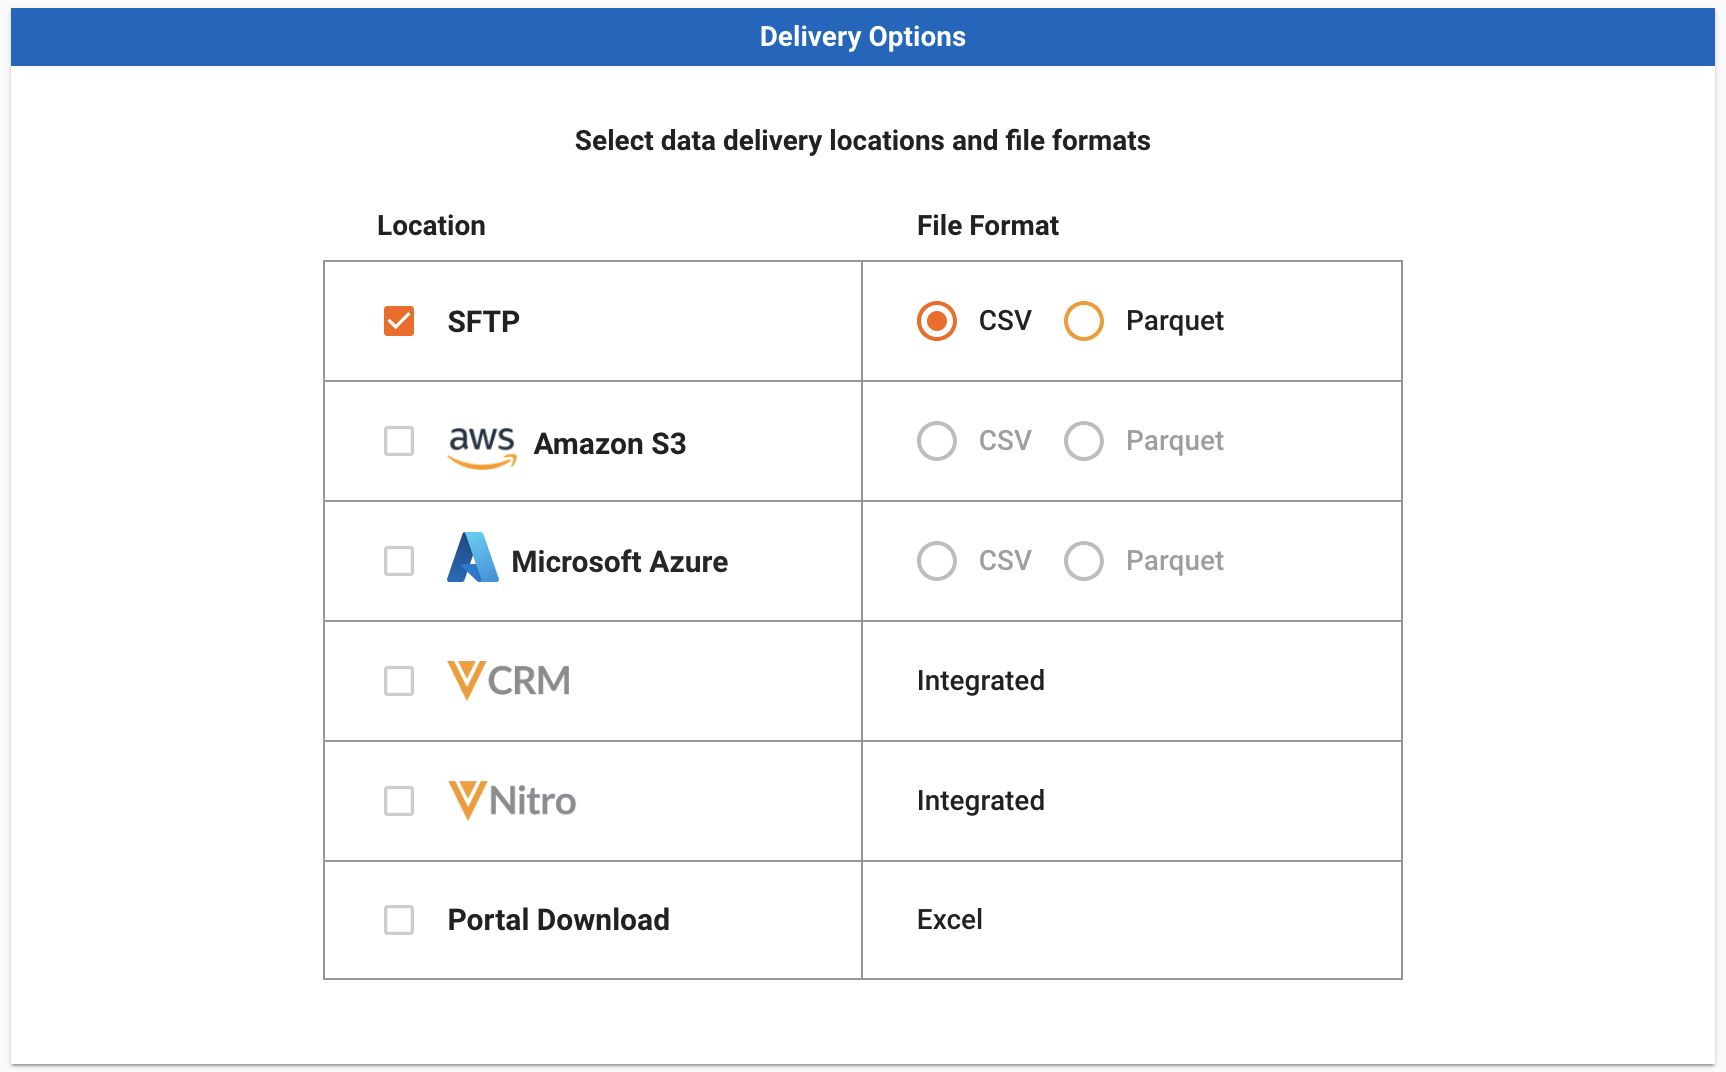
Once you have selected your delivery locations, you may be prompted to select a file format for your delivery. You can select one file format per location for your delivery. The available file formats for each location are managed by System Administrators via the Delivery Configuration page. Currently, Veeva Compass offers data in CSV and Parquet format. For more information on the data delivery files for Parquet and CSV, refer to Understanding the Files & Format.
Refer to the Accessing the Data section for instructions on how to access your data.
Schema Versions
Customers with multiple data delivery schemas available will see an additional selection option beneath the delivery location and file formats menu enabling them to choose the data schema version to be used for the job. When only one data schema version is available, this section will not be displayed.
Details about available data schema versions for each product and tips for transitioning to new schemas can be found under Data Schemas.
Review & Submit
For Prescriber level data, once you have completed the Delivery step, click on Next to move on to the Review & Submit step. Review & Submit is the final step before the query is submitted for processing. This step allows you to confirm the details of your data pull prior to submission. To make changes to your market definition or applied filters, click on “Edit” below Define Prescribers.
To make changes to your schedule, time frame or delivery location, click on “Edit” below Delivery.
For both Prescriber and Zip level data, when you are ready to submit your query, click “Submit”.

Upon clicking “Submit”, a modal will appear for you to provide a name and select a license (if applicable) for your query, as well as manage sharing settings.
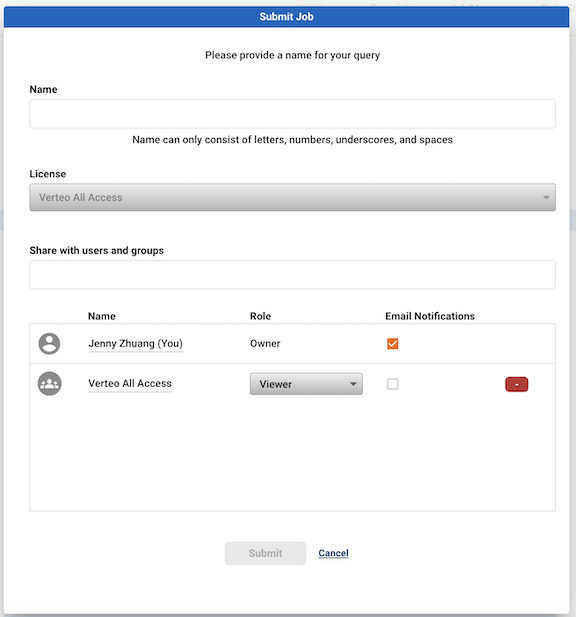
Note Query names can only consist of letters, numbers, underscores and spaces.
Sharing Settings
Sharing settings allow users to manage roles and access to jobs. These roles determine the user’s permissions (allowed actions) on the job. Roles can be assigned to individual users or groups. Users can also subscribe to job email notifications (e.g. job completion emails) via sharing settings.
By default, upon selecting a license, the user submitting the job is assigned as the Owner role, and any groups associated with the selected license are added to the Viewer role.
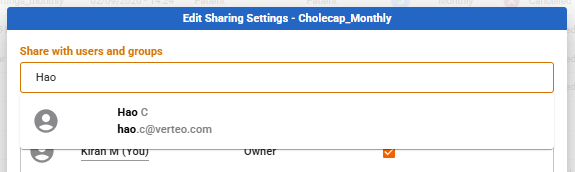
You can add additional users and groups to the sharing settings by searching in the “Share with users and groups” search bar, then clicking to select the user or group. The list of available users and groups will be filtered to those associated with the selected license.
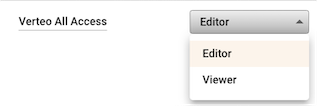
By default, the newly added user/group will be assigned the Viewer role. To update the role for a user or group, click on the drop-down menu in the Role column. Note that to reassign another user as the Owner, you must submit the job first, then update the sharing settings in Job Manager.
The table below provides details of permissions that are available for each role.
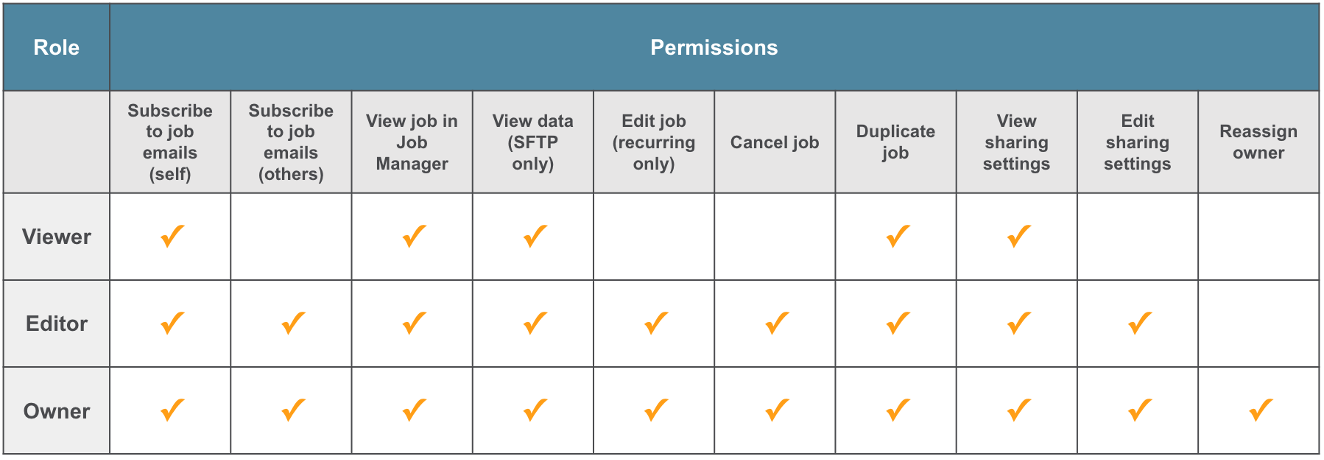
Note Users with the Read-Only profile cannot be assigned as Owners of jobs, and are limited to Read-Only visibility even if they are made a Viewer or Editor of a job. Full descriptions of user profiles and permissions can be found in User and Group Management.
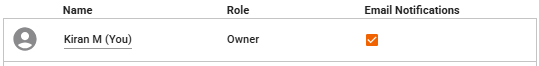
You can also subscribe users or groups to receive email notifications related to the job, such as when the job completes or is cancelled. To subscribe a user or group to email notifications, select the “Email notifications” checkbox.
Note that for one time jobs, email notification settings can only be updated when the job is submitted or during processing.
You may preview the list of users in a group by hovering over the group name. To remove a user or group from sharing settings, click on the “-” button.
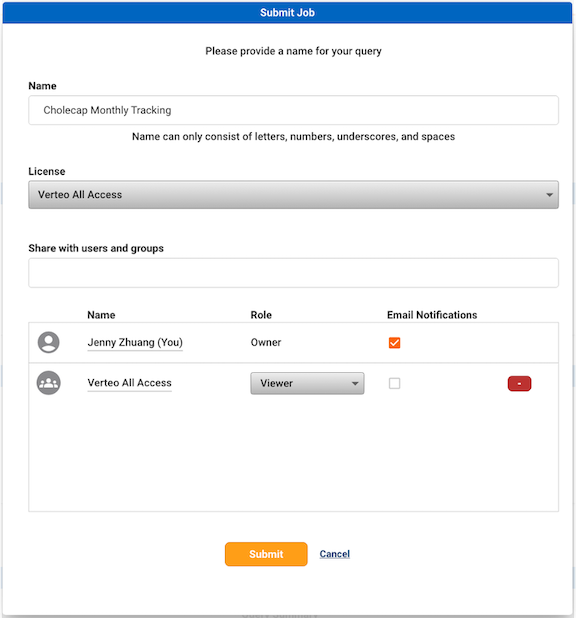
Submit Job
Once you have made any desired updates to sharing settings for the job, click on “Submit”. You can check the status of your job in the Job Manager as well as manage the sharing settings. Confirmation of the Query ID, Query Name & Delivery location will pop up once the data pull is successfully submitted. You can check the status of your data pull in the Job Manager.