On This Page
Overview
Explorer enables users to quickly generate a set of key metrics across all of the Veeva Compass data right in the Portal.
Users can select products, diagnosis codes, and/or procedures code, and then metrics are generated for the number of patients, healthcare providers, and records - all in seconds to minutes. Metrics can be calculated for 2020 - 2023.
Using Explorer
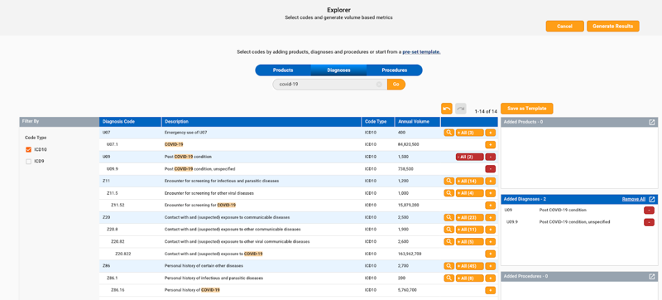
To pull metrics, navigate to Explorer via the Pull Data tab. Click on “Edit Codes” to add your products, diagnoses, and procedures of interest.

You may add products, diagnoses, and procedures using Code Searcher or templates. Refer to Code Searcher for more information on adding codes via Code Searcher. Refer to Select Templates for more information on adding codes via query templates. Once you have finished adding codes, click “Generate Results”. Results are generated within several minutes.
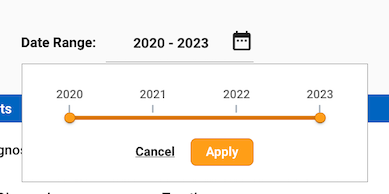
By default, metrics are displayed from 2020-2023. You can select a date range to include in Explorer by clicking on the calendar icon, then using the slider to select the desired years. Click Apply to update Explorer with the new date selections, or click Cancel to return to Explorer without updating dates. You may also edit codes and generate results by clicking “Edit Codes”.
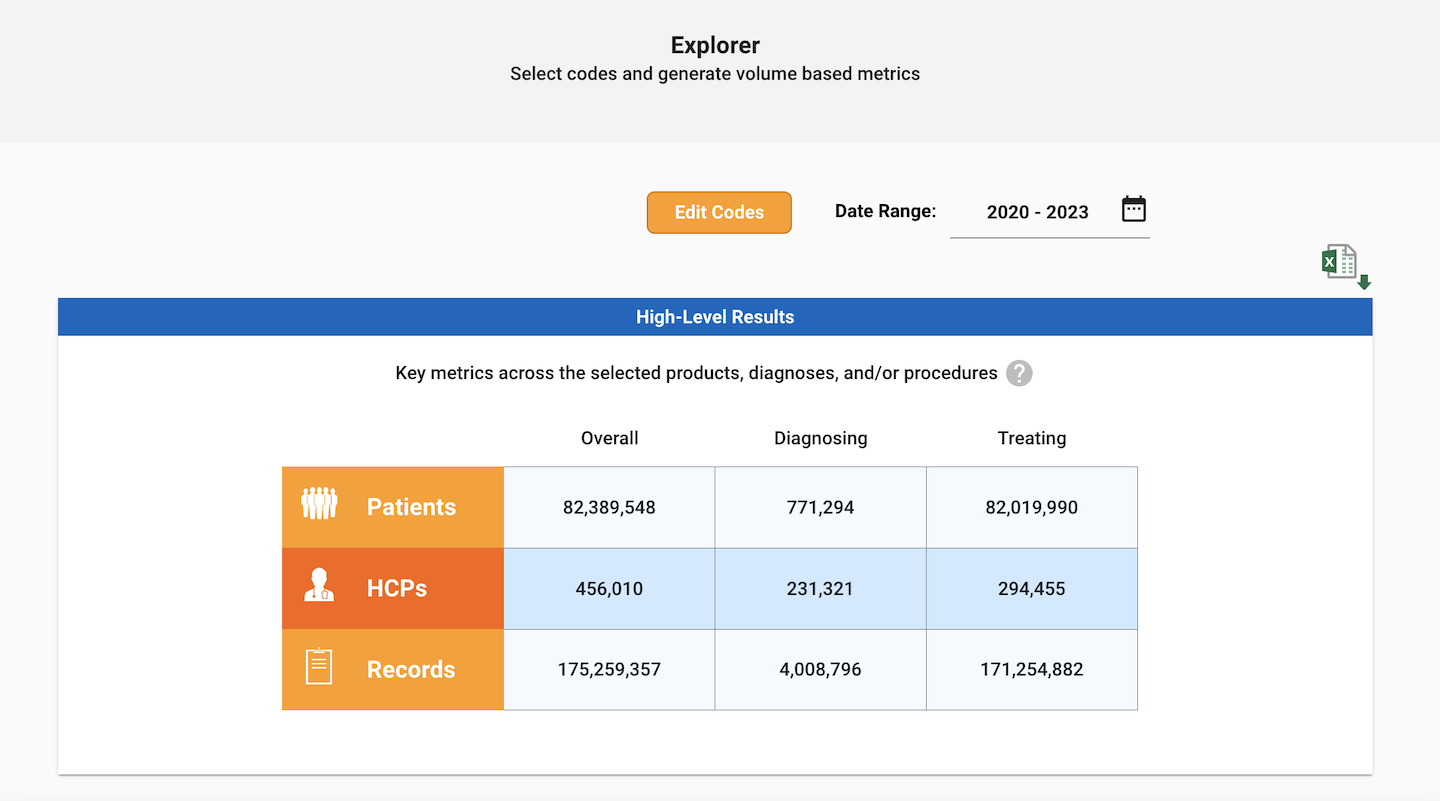
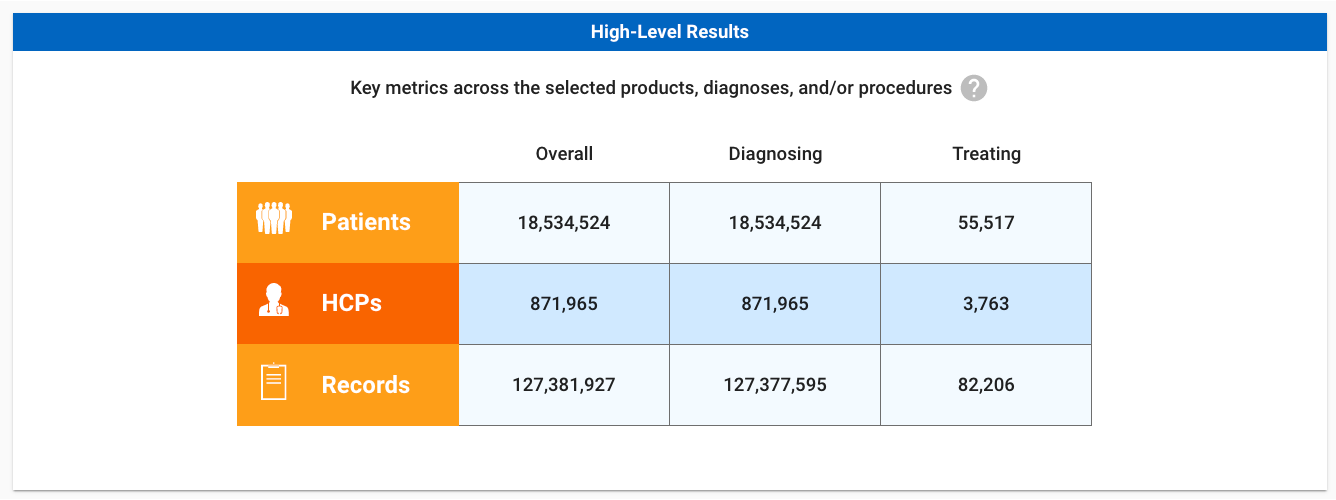
High-Level Results
The High-Level Results pane shows the number of patients, healthcare providers (HCPs), and records across all selected products, diagnoses and/or procedures.
- The “Overall” column shows metrics across all selected codes.
- The “Diagnosing” column shows metrics across all selected diagnosis codes.
- The “Treating” column shows metrics across all selected product and procedure codes.
Note that these metrics are approximations (within 1-3% of precise calculations) in order to enable high-speed results; additionally, the HCP count does not include healthcare organizations (HCOs).
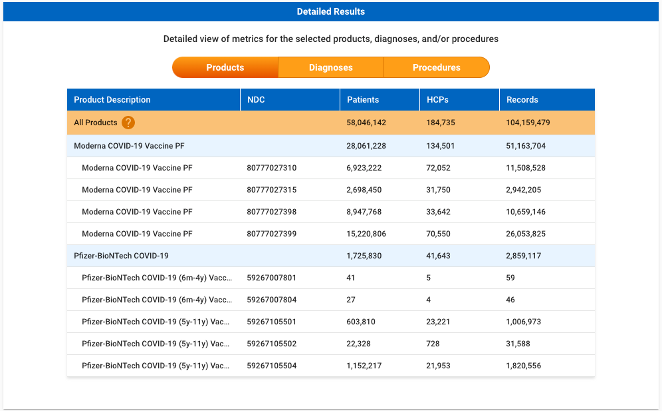
Detailed Results
The Detailed Results pane shows a detailed breakdown of the number of patients, healthcare providers, and records for the selected products, diagnoses, and/or procedures. You may toggle between views using the pill button. The orange “All Products”, “All Diagnoses”, and “All Procedures” rows show metrics across all products, diagnoses, and procedures, respectively. Note that these metrics are approximations (within 1-3% of precise calculations) in order to enable high-speed results; additionally, the HCP count does not include healthcare organizations (HCOs).
The code-level metrics below are precise counts for the selected codes. For products, precise counts are shown for both the selected brands as well as the individual products within a brand.
Download Explorer Results
To download the Explorer results to your local computer, click on the Excel icon. The Explorer results file (available in Excel format) contains a list of the codes (products, diagnoses, procedures) as well as the high-level and detailed Explorer results. Note that the file always contains what is currently being seen in Explorer, and does not get retained when navigating away from Explorer.